
I had an appointment this morning and just got back in so I won't have time to post my usual insightful and provocatively written blog. I was going to skip it today but in doing my usual morning search for possible additions to the MANDA Fund--my M&A post-takeover announcement fund (see July 18 blog)--I stumbled upon a nifty resource on the Reuters news site: a daily newsletter detailing the latest M&A activity (including IPOs) that's emailed to your inbox before 8am ET. How cool is that? It'll sure save me a bunch of time in the morning. But this newsletter is just one of nine others that are free for the asking. I also signed up for the technology report. the health report, the Morning Digest, and my favorite--the Oddly Enough report that contains “quirky, strange-but-true stories from everywhere.” I could use a good grin with my morning cuppa joe.
That's my tip for the day. I'm always grateful for anything that makes my day go more smoothly and I admit that it's the little things in life that give me the most pleasure...although I certainly wouldn't be upset if I won the lottery.
Disclaimer: I have no personal or professional affiliation with Reuters nor do any of my colleagues, friends, or family (that I know of).
To sign up for any of the Reuters newsletters, go to https://commerce.us.reuters.com/profile/pages/newsletter/begin.do
Thursday, July 31, 2008
Wednesday, July 30, 2008
Cooking Tools #7: Fibonacci Support & Resistance Levels
I've mentioned in blogs of days past about Fibonacci ratios and how they are used by market technicians and traders to determine support and resistance levels, but I never defined them. Seeing as how popular they are and how they really do reflect price movement, I thought I'd provide a short overview of the subject so that you'll know what they are when people mention them.
What is a Fibonacci number?
The famous Fibonacci number sequence was named for an Italian mathematician, Leonardo di Pisa--aka Fibonacci, who wrote about the number sequence (although he did not invent it) as well as introducing the Arabic number system to Europe in his 13th century bestseller, Liber Abaci, known in English as the Book of Calculation. Eight hundred years later, Dan Brown also used Fibonacci numbers as an integral part of his bestseller, The Davinci Code. If you're one of the few people on the planet who hasn't read this book, let me explain Fibonacci numbers. They are nothing but the sequence: 0, 1, 1, 2, 3, 5, 8, 13, 21, 34, 55, 89, 144, 233... where each successive number is formed by the addition of the previous two numbers. The golden mean or golden ratio, is an approximation formed by the ratio of two adjacent numbers in the sequence. The larger the numbers, the better the approximation. For example, 5/8 = 0.625, but 144/233 = 0.6180 which is a much better approximation to the golden mean. (233/144 = 1.6180 is also called the golden mean, FYI.)
Why are they significant?
The golden mean has significance in many areas of art and science, and it also plays a prominent role in stock chart analysis. But the 61.8% level is not the only level of significance--levels formed by other ratios provided insight into trading psychology, too. These other levels are determined by the ratio of two Fibonacci numbers separated by one, two, or three numbers. For example, the next important Fibonacci level is given by 89/233 = 0.382 or the 38.2% level. Of lesser importance is the next level, given by 55/233 = 0.236 or the 23.6% level. You should note that although the 50% retracement level is not a Fibonacci level (I know it can be derived from 1/2 but from no other Fibonacci numbers) it is considered to be an important psychological trading level and so technicians include it in their analysis.
What these Fibonacci levels do is provide a clue as to intermediate levels of price support and resistance between two extremes. To find these levels, subtract the vertical distance between two extreme points and divide that by the key Fibonacci ratios of 23.6% (0.236), 38.2% (0.382), 50% (o.50), and 61.8% (0.618). Note that Fibonnaci levels aren't always exact but they do provide decent ballpark numbers. The figure below is a recent chart of the S&P along with key Fibonacci levels.

Conclusion
Many charting programs include Fibonacci ratios in the form of retracement levels, arcs, and fans. Note that the strength of a level intensifies with each price test so that when the level is finally broken, the price movement will be particularly strong and trades made on that breakout generally have a much better chance of success.
As with other indicators, Fibonacci ratios aren't always accurate, so use them as a guide to your trading rather than as an overall trading strategy. They are particularly useful in placing stop-losses or setting price targets. Some traders use pullbacks to Fibonacci levels to add to existing positions. Fibonacci ratios are also used in Elliott Wave Theory, Gann retracement levels, and in Gartley Patterns.
Tuesday, July 29, 2008
Stop It!: Stop-Loss Results for Bearish Scenarios
In the May 27th blog we looked at different types of common stop-loss strategies and discussed when and how to use them. In the June 13 blog we looked at stop-loss results for bullish scenarios and found that absolute stops on the order of 5-15% fared better most of the time compared with trailing stops and the ratchet stop fared the best overall but sometimes at the expense of a higher drawdown. Although it wasn't noted at the time, the cases with no stop-losses did surprising well with average drawdown. Will this be the case with the shorts? Let's find out.
The Set-Up
The set-up this time was similar to the long scenarios, the exception being that I only used 5 stocks for my short portfolios instead of 10. The reason for this is that I've found that there's far fewer choice candidates on the short side. What I did was to look at three different portfolios of 5 stocks each--one composed of stocks priced between $5- $10, one composed of stocks priced between $10 and $30, and the other of stocks priced between $30 and $100. My simulation consisted of finding stocks breaking to new 250 day lows, which is a good strategy in a bear market. If more than 5 candidates showed up, an extra “ickiness” factor was added as a sorting technique. I ran my simulations at two different times when the market was in a downtrend, from 3/19/02 to 7/24/02, and from 11/01/07 to 3/17/08. (Simulation and account information are summarized at the end of the article.*)
The following stops were used: Trailing stops between 5%-50%, Gain/Loss stops with Gains set at 1000% (literally no stop on the gain side) and losses varying from 5%-25%, a ratchet stop, and finally, no stop at all. The following table shows the results. The first row of each simulation shows the profit or loss over the time period. The second row is the number of stocks traded each of which involves two trades, a sell and a buy. The win/loss percentage is in the third row followed by the maximum portfolio draw-down.

Results summary
As I said before, two scenarios don't make for highly accurate statistics but we can note certain trends. The most interesting and certainly not the most expected result is that the best stop-loss seems to be no stop-loss at all! Not only does it post decent returns, but with the least number of trades, the highest win/loss ratio, and lower drawdowns. I was shocked! The next best stop-loss systems are the 25% loss and the ratchet stop. Although the trailing stops did well in the 2002 cases, they did so at the expense of significantly more trades and larger drawdowns. In the 2007-2008 cases, they underperformed the other strategies except for the low priced stocks.
Comparing Bull & Bear market scenarios
If you compare the June 12th bull market table with the bear market one above, you'll see some interesting differences between trading in these two environments. It's a market maxim that trading in bear markets can be more profitable but it's a riskier endeavor. This is clearly evident in the tables where, in the bull market cases, the maximum profit over all scenarios is 73% and the greatest drawdown is 24% whereas in bear markets, the maximum profit is 191% but the maximum drawdown is a gut-wrenching 60%. (All scenarios are on the order of 3-5 months.) The table below compares the average profits and drawdowns for all the bull and bear scenarios as well as for the no stop-loss case. (Note that the numbers below reflect 50% margin accounts.) It's no wonder many people are adverse to shorting stocks!

Conclusion
I guess the moral of the story is that to get the most bang for your shorting buck, setting no stop-loss is the way to go, but you've got to be able to swallow the draw-downs. If you can't stomach that, don't think about shorting--just stay in cash or cash equivalents and take a long vacation. As in gambling, the real trick is to know when to fold 'em. Hindsight is indeed 20-20, but when should you finally cover your positions? The answer is: When the bear market is over. (Don't hit me!) Look at other indicators, especially the VIX, and if that moves below 20 and stays there for several days, I'd go ahead and cover my positions. But I don't think that time is now or anytime soon.
Now you have the long and the short on stop-losses. Use them...or not!
*Simulation Conditions & Parameters: $9.95 commissions. 2% account interest; 3.5% margin interest. All portfolios were algorithmically selected (meaning that I didn't hand pick them, thank the Lord!) according to set parameters. When a stock hit its stop-loss, it was covered. A new search was run and the stock that came to the top of the list was then selected for shorting. All trades were executed at the market-on-close price. Trade sizes reflected a fixed, equal percentage of the current cash in the account. Profit/loss percentages are the result of using 50% margin on all trades (long and short included).
Monday, July 28, 2008
Fi-Fie-Foe Financials
Due to technical difficulties as in my internet connection being unavailable for most of the trading session, I'm again forced to kluge together another blog that hopefully will be of some passing use and interest. In regards to last week's query, “Are we in a new bull market or is this rally just another bear trap?,” today's action should leave us with no question that the bear isn't about to go back into hibernation. All of the indices are heading to the outhouse with the financials leading the pack. It's been speculated that last week's rally in this sector was due in part to massive naked short covering that, by the way, will end tomorrow unless the SEC decides to extend the ban (which it should!). Most of the stocks affected by this short squeeze have already rolled over and their charts are not pretty. Not only do the charts look butt-ugly, but the news across the board looks pretty grim as well. It was reported today that credit card deliquencies are up sharply compared with a year ago which bodes even worse for the already ailing companies in this space: Visa (V), American Express (AXP), Citi (CIT), Discover (DFS), and MasterCard (MA). The best of the bunch by a country mile is MasterCard but even that has gotten a 20% haircut in the past couple of months.
Are there any good plays here?
There are a multitude of good plays--pick a stock and short it--but there are a few that are more compelling than the others.The risk adverse investor might want to take a gander at the SKF, the Ultra-Short Financial ETF. It's recovering from a recent low and is trading around $142. I'd hop on that train and ride it until the VIX trades above 30 (it's now at 24) and then jump off. The last time the VIX hit 30 (July 15th), the SKF was trading at $200, a 40% increase over today's close.
Next on the list is American Express, AXP. Since inception, this stock has been a steady eddy until last summer when the credit crisis began to unfold. Since then, the stock has dropped over 40% and has broken to a new five year low. The monthly chart view is very bearish and could be a great shorting opportunity down to the $30 level at least for a 14% return.
My final pick is market bellweather Merrill-Lynch, MER. It has the worst looking chart of the major financial institutions although Goldman-Sachs (GS), Lehman (LEH) and Morgan-Stanley (MS) are not far behind. Currently, Uncle Merrill is threatening to break an almost ten-year low put in a couple of weeks ago. Minor support is at $20; major support around $16.
No, folks, the fun in the financials is not over. The market is handing us a bunch of sour lemons so let's make some sweet lemonade. Drink up!
Friday, July 25, 2008
Cooking Tools #6: Introduction to Candlesticks
Cooking Tools #3 showed how candlestick formations can be used to determine reversals in price trends. What I really should have done first was to give a primer on basic candlestick formations which would provide you, dear reader, with the building blocks for the more complex patterns I'll be detailing and referring to in the near future. Candlesticks are extremely useful tools in technical analysis and with proper application, they can make a significant difference in your trading success. So, if you're unfamiliar with them, this is a great place to start. There are many other worthwhile candlestick resources, both online and in book form, and I strongly encourage you to peruse them for further information.
Basic candlestick types
As discussed in Cooking Tools #3, a candlestick is one way of representing the high, low, opening, and closing prices during a specified time period. The candlestick is composed of a body which is defined by the opening and closing prices and a shadow, wick, or tail (all three terms are used by chartologists) which extends from the body to the high and to the low prices for that time period. (See Cooking Tools #3 for a breakdown diagram of a candlestick.) If the price closes higher than the open, the body is traditionally colored in white (some folks like me prefer green) and represents a situation where there are more buyers than sellers. On the other hand, a black (or red) body signals that the price closed below the open and indicates more sellers than buyers. To a large extent, candlesticks are a measure of market sentiment which is how they are interpreted and why they are so useful. What a candlestick doesn't tell you is what the price action was like in the interim--something to keep in mind especially if you're looking at candlesticks marking larger time frames.
Here are the major single candlestick formations. (Note that the bodies can be either black or white.):
Long Day/Short Day: A long day shows a large price movement from the open to the close, and conversely for a short day.
Marubozo: This is a candlestick with a bald head, meaning there's no wicks on either end. This signals that the open and the close represent the high and the low of the day respectively showing conviction in price.
Spinning Tops: These signal indecision marked by have small bodies and long wicks. They are generally more meaningful as part of more complex patterns.
Doji: Doji (the plural of doji is doji) form when the price closes at or very near the opening price signalling a tug of war between the bulls and the bears. Doji are important candlestick types which are typically found in market reversal patterns. Different types of doji signal different market conditions.
Dragonfly: The opening and closing prices occur at the high of the day.
Gravestone: The opening and closing prices occur at the low of the day.
Long-legged: The open and closing prices occur near the middle of long wicks.
Umbrellas: Umbrella formations include hammers and hanging men and are also used to identify market tops and bottoms. (See Cooking Tools #3.) An umbrella consists of a narrow body usually with little or no upper wick but with a long lower wick. When an umbrella forms at the bottom of an extended decline, it's called a hammer; if it forms at the top of an advance, it's called a hanging man. Both formations signal a reversal in price movement.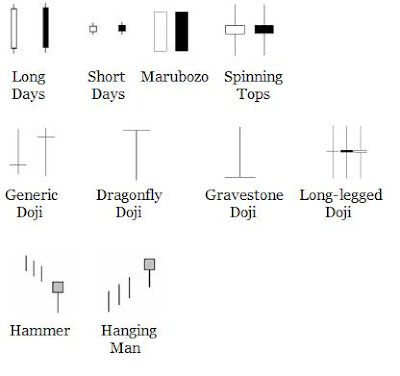

Thursday, July 24, 2008
Cooking Tools #5: Tick-Talk
Yes, I'm still bogged down in my stop-loss research. Since all of my lackeys are on vacation (haven't they heard of a staycation?), I've got to do it myself. Sigh. Anyway, I guess the candlesticks formed yesterday weren't lying. The market did go down today. Yay me for predicting it. Boo Mr. Market. I'll be watching to see if the VIX breaks above 25. If previous history is any indication, every time it has done that it has also risen above 30, and since the VIX and the market move inversely to each other, this has meant new relative lows for the major indices.
Now the VIX isn't the only indicator of market direction--there are other indicators used by traders such as the equity put/call ratio, the Arms Index (aka the Trin), and the Tick. Today I'm going to introduce the Tick for those of you unfamiliar with it.
What is the Tick and why should I care?
The Tick is nothing more than an indication of directional movement. You can look at the tick on individual stocks or on market indices. Since we're more interested in the markets right now, we'll be referring to the Tick on the S&P 500. Before decimalization, one tick represented the smallest increment in price, say 1/8 or 1/4 of a point. Nowadays, it reflects whether a stock is trading to the upside or the downside. The Tick on an index, however, is slightly different--it reflects the difference between the number of stocks that are trading on an uptick with those that are trading on a downtick. Clearly, if there's a lot of selling, the tick will be a negative number. In general, the majority of Tick values range between 1000 and +1000 on “normal” trading days, but it's those days when the Tick enters extreme levels that traders should take note of.
Tick extremes
Extreme values on the Tick range from around +2500 and above and from -2500 and under. When the Tick hits one of these extreme values, a market reversal is either imminent or will usually occur in the very near future (within a day or two). What the Tick can't tell us, unfortunately, is the extent of the reversal--it could last for months or only a few days. Compare the daily charts below of the S&P 500 with the Tick.


Conclusion
Now you have another tool to put in your arsenal of indicators. Note that by itself the Tick isn't perfect; it's best used in conjunction with other indicators. Not only can the Tick be used to predict daily price movement, it can also be used successfully as an intra-day indicator which daytraders might find useful. (When I was daytrading S&P futures, I used the Tick combined with the Trin, but I'll leave that discussion to another day.) Motto: The market won't tick you off if you take note the Tick!
Wednesday, July 23, 2008
Market Reversal?
I'm still bogged down in research (grrr!) but am taking time out to toss in my two cents concerning today's market action. The major indices are all putting in what appears to be short-term tops. How can I tell? Because of their topping tails which are forming the likes of doji stars and shooting stars, both bearish candlestick formations. (See Cooking Tools #2.) The Regional Bank Holders (RKH) and the Financial Spider (XLF) are showing similar topping patterns. What does this mean? It means we'll likely see the markets turnaround tomorrow. Whether this is the start of a real bull run or another bear trap can't be determined as yet. I've said before that I and many others much more in the know still believe there's more unwinding left to do in the credit market and until the final shoe drops, I wouldn't be loading up on long positions especially in financials. I think some of the turnaround in this sector can be attributed to naked short covering coming on the heels of the SEC prohibiting the practice in some stocks with threats to extend it to the entire market. I do believe that patience here will be ultimately be rewarded.
I'll be back in full tomorrow. A bientot, mon ami.
I'll be back in full tomorrow. A bientot, mon ami.
Tuesday, July 22, 2008
Another MANDA Addition + Market Potpourri
I was hoping to post the results of my stop-loss analysis of shorts but there was another software snafu as typically happens when I really want to get something out so I'm hastily kluging together a short blog for today. Earlier this morning I picked up shares of Bluegreen Corporation (BXG) which has signed a non-binding letter of intent to be sold to Diamond Resorts International later this year. The $15 a share offer represents an 132% increase over yesterday's closing price of $6.44. None of the press releases mention if it's a cash-only offer but I'm assuming so since Diamond is privately held. Needless to say the Bluegreen board was thrilled with the magnanimous offer, and so was I since the $15 price represents a 25% increase over the $11.99 price at which I purchased the stock for the MANDA portfolio as well as my own privately managed one. (Both companies are in the vacation resort business.)
Market: Is it a Bull? Is it a Bear?
With the VIX spiking over 30 last week, a breather from the bear was in order. But will this recent rally last? On the bullish side, the VIX only two days ago broke its 20dma which provided solid support. It's now sitting at 22 and a break below 20 would be a signal to exit short positions. The Dow Transports, a leading indicator of market direction, handily broke overhead resistance today at 500. The other indices are following suit as they're all trading in the green. But the bears still have some roar left. Consider the Buy/Sell ratio (BSR). A value over 1.0 is considered bullish as there are more buyers than sellers (my apologies for the no-brainer). However, the BSR is still sitting in the basement at 0.21, although it's up from its 0.12 relative low last week. In my opinion, it has a long ways to go before I'll come out of hiberation.
A few market musings
Glancing at the new highs list today, I see that Finish Line (FINL), the athletic footwear retailer, is on it. In fact this stock has gained over 500% since this January! Could this be the start of a turnaround that was forecast for retail? (See blog on 2/13 for info on the retail sector.) Also making the list are Identix Pharmaceuticals (IDIX) and Cyberonics (CYBX), both in the rising healthcare sector, some of which we looked at in the July 8-10 blogs. Identix, a biotech specializing in viruses and infectious disease treatments, is trading just over $8--a rise of nearly 300% since last December. The stock didn't quite make it on my biotech buy list because at the time is was caught in a trading range. Yesterday it broke out of that range and is looking to make a run towards its next resistance at $8.50. I'll be very interested to see how it performs after it reports earnings before the bell next Tuesday. If investors like what they hear, it might be a good time to get in on it. Cyberonics makes treatment devices for epilepsy and depression (good news for the aching bulls!). Its stock has rocketed from under $10 in February to over $27. Apparently, it's doing something right because institutions have become heavy buyers in recent weeks. The stock has a tendency to bounce off its 20dma and I'd wait for it to come back to that level before I'd jump in. (In the $24-$25 range.)
That's about for today. One of my goals in writing this blog is to offer my readers something they can dig their teeth into--you know, something more than just exposition. Not that that doesn't have its place, but it's information that is available on hundreds of websites. So my apologies for coming up short today. But if the gods are smiling on me, I'll be able to publish the results of my stop-loss testing for short positions in tomorrow's blog. Same bat-time, same bat-channel!
Monday, July 21, 2008
The Shocking Truth About Naked Shorting
While shooting the breeze the other day with Professor Pat, I asked him if he knew anything about naked short selling. He said no and I said great! Why don't you write an article about it? And so he did and here it is. It's a good read and trust me, you're not going to like the practice of naked shorting. The SEC should be ashamed of itself at allowing this clearly unfair--if not downright fraudulent--practice to occur and the brokerage firms should be shamed as well for engaging in it. I'm glad this practice is being exposed because last week's panic in the banking and mortgage-backed securities sector forced the SEC to ban naked short selling on 17 brokerage stocks along with Fannie Mae and Freddie Mac for 30 days.* (BTW, if you hold stock in either of those companies, get out now as their balance sheets are only going to get worse.) Former SEC Chairman Harvey Pitt was recently quoted as saying that he hopes the SEC will extend the ban to include all publicly traded stocks forever. Finally, a breath of sanity!
Anyway, enough from moi. Here's Professor Pat's explanation and take on the shocking practice of naked short selling.
Shenanigans Beyond Belief!
While watching CNBC the other day one of the commentators happened to mention the practice of naked short selling and how that might be affecting the downward trend of recent markets. I had heard the term before and never thought much about it but this time I wondered what exactly is the mechanism that is followed for such transactions.
Normal short selling is simple: The short seller borrows stock from someone who has agreed to loan them their stock. Since stock is being loaned, the seller agrees to pay interest on the value borrowed for the duration of the loan. The short seller then sells the shares on the open market and pockets the cash. Assuming the value of the shares have decreased at a later point in time, the seller buys back the shares on the open market. The stock is then returned to the lender and the interest on the borrowed amount is paid. The balance remaining is the profit from the short sale. This is all perfectly legitimate as everyone knows what is happening and they have agreed to it, or at least they should. If you have a brokerage account and you keep your shares there in what is called "street name," you have agreed to let the brokerage firm loan your shares to short sellers at their discretion. This is legitimate as you have been informed of and have consented to this practice as part of the account terms and agreement.
However, when someone or some institution practices naked short selling they are skipping the part where they first borrow the shares to sell. They are, in fact, selling something they don't have. Three days later at settlement time they have no stock to deliver unless they have borrowed the shares in the meantime. This is much like the kiting of checks where you rely on the clearing delays to create cash you don't actually have in your account. According to the SEC, naked shorting is perfectly legal unless the selling itself is done for the purpose of causing the price of a stock to drop rather than benefiting from a drop due to other reasons. Wikipedia quotes an "official with the SEC" saying that 1% of all dollar denominated trades (amounting to $1 billion every day) experience a settlement incident requiring additional time to complete, perhaps necessary for the stock to decline further for the short sale to become profitable at the expense of the buyer. This practice is even excused under the guise that it adds to market liquidity.
Now, let's say that I advertise to sell a used car and I find an out-of-town buyer who buys the car on the phone and sends me the cash for the car to reserve it. "I'll be by in three days to pick it up" he says. If I were to enter into such a transaction without ever actually having a car to sell I would be guilty of fraud and would go to jail. Selling something you don't own is usually a criminal act whether it be a used car or the Brooklyn Bridge. But when it comes to selling stock it's surprisingly not! Brokers do this kind of thing all the time and they don't have to go to jail.
There is no question that naked short selling is contributing to the current decline of the financial markets and therefore all our investment portfolios and 401K's. The brokerage houses are complicit in aiding and abetting this shady and dubious activity. Why do they do it you ask? Well, because they make money doing it that's why. They make money on every sell transaction and they make money on every buy transaction. For them, volume is what generates revenue. So, if a valued large client says they want to short naked they will likely go along for as long as the naked shorter is able to eventually deliver the promised sold stock and pay their brokerage commissions. The brokerage houses may even stand behind the short sale themselves making good on the transaction in the event of a default by the short seller. The brokerages can even keep this up, presumably within regulatory limits, as long as the eventual buyers of the stock do not demand to take physical delivery of their shares. Maybe we should all do that.
So, why sell naked instead of correctly borrowing the shares first? Well, maybe there are insufficient shares available to be borrowed. Or maybe a big advantage to the naked short sellers is the presumed absence of the interest charge that would normally be paid on the borrowed amount. Nothing borrowed, no interest cost.
In 1985 the SEC enacted Regulation SHO to combat abusive naked short selling. It has so many loopholes however that it may as well not exist. Market makers and brokerage houses are exempt from the rule. Brokerages also have immunity if the naked short selling client is "deemed" to own the stock they are selling. Yeah, right! While this nonsense is permitted here in the US one can only imagine the unbridled chicanery that goes on in relatively unregulated foreign markets.
So, what do we do about this? For now what I want is for all of you to get up out of your chairs and go to the window, open it and stick your head out and yell "I'm as mad as hell and I'm not going to take this anymore." ... with apologies to Peter Finch.**
-Written by SMCB Guest Contributor, Professor Pat
*What is so ironic is that the stock of the major brokerages are now exempt from naked shorting but the brokerage firms themselves are not exempt from doing it! To view the current SEC ruling regarding naked short selling and a list of those exempt from it, click on the following link:
http://www.sec.gov/news/press/2008/2008-143.htm
**If you'd like to do more than shout out the window, send a brief online note to the Senate Banking Committee. If you live in a state represented by a Banking Committee member, you can also contact that person. Here's the link to the Senate Banking Committee website (don't worry--it's easy to use and sending a note will only take a minute):
http://banking.senate.gov/public/index.cfm?FuseAction=Information.Membership
Note on Roche buyout of Genentech
It was announced earlier that Roche offered to buyout the rest of Genentech (DNA) stock that it didn't already own for a cash price amounting to $89 per share. In premarket trading, Genetech is currently being bid between $94 and $95. Why so high? Because the Street figures that $105 more accurately reflects the stock's worth. That amounts to roughly a 10% premium over the current price. It's a nice sum, but I'm not going to take the trade for my MANDA Fund because it's unclear as yet if Roche will meet that price, although they probably will. If they do, then I'll reconsider but for right now, it's too risky for my tastes.
Friday, July 18, 2008
Introducing MANDA
Yesterday we looked at established funds whose primary focus was buying M&A target stocks just after the acquisition announcement was made. I mentioned that Mario Gabelli, the manager of the Gabelli ABC Fund, has been doing this for 15 years. Although his year-to-date return is down -3.2%, he's never ended a year in the red. The fund's ten year average is a modest 6.7% but risk is minimal and best of all, the fund does quite well in bear markets. So why am I bringing this up again?
Being in a competitive mood, I thought “Hey, why don't I give Mario a run for his money?” So, I'm going to set up my own M&A fund to see if I can outperform the big guys. But what to call it? Well, after spending about three seconds on this I decided MANDA (M and A) would suffice. It's not the most clever title but it's one that I'll (hopefully) be able to remember.
The MANDA Fund set-up
The fund will open with $100,000 in capital. Trades will be entered on the target company at the first possible moment after the announcement is made. The majority of announcements are released when the market is closed, so those trades will be executed as soon as the market opens. (According to my broker, market-on-open orders are not guaranteed to be executed at the opening price.) If the announcement is made during market hours (which rarely happens), a trade will be entered as soon as possible as I'll need a few minutes to assess the deal. I'm allowing $10 as the trading fee which includes commissions ($9.95/trade) and regulatory costs which typically amount to only a few cents. No trade will be more than $10,000 or 10% of the total portfolio value. Account interest will be included at current rates and no margin will be used. As for terms, I'll be looking primarily at cash-only deals (no stock swaps), but if there's a compelling cash plus stock swap, I'll consider that, too. Evaluation will also be based on the terms of the deal: hostile takeovers and ones fraught with financial and/or regulatory issues may not make the cut. That's about it.
The first two trades
On July 10th, Dow Chemical (DOW) announced it will be buying Rohm Haas (ROH) for $78 in cash. The deal, partly financed by Warren Buffett and the government of Kuwait (Dow just sold its plastics division to Kuwait Petroleum), is expected to close sometime in early 2009. On the date of the announcement, Rohm stock opened at $73.80. I'm picking it up today for $74. The company just raised its dividend to $0.41/share. Beginning in 2002, the company has consistently paid quarterly dividends--February, May, August, and November. If I can collect two of those at the current price, that will give me a total gain of $4.82/share for a six-month return of 6.5% or 13% annually. Pretty good. Even if Rohm fails to pay a dividend, the six-month return will still be a decent 5.4% (10.8% annual return).
My other holding is Community Bankshares (SCB) which I highlighted in my June 26 blog. I bought that for my own portfolio on that day at $18.85/share and will be adding it here at that price. The expected six-month yield (including dividends) for SCB is 12.4%.
Current portfolio and future picks
When I find a compelling takeover candidate, I'll let you know on the day that I enter a trade. Current portfolio picks will be shown in the MANDA portfolio which will be located under Portfolios in the Blog Topic section to the right (as soon as I do a little layout rearranging).
Let's see if we can beat Mr. Gabelli's ABC Fund. Go MANDA!
Thursday, July 17, 2008
M&A Funds
I mentioned before that putting out a daily blog is draining, especially one where I try to offer something original (it always is to me). Well, today is one of those days where the creative juices seem to be stalled. I'd rather be at the beach than tickling the keyboard ivories, but my conscience won't let me play hookey. So to come to a truce between the angel whispering in one ear and the devil in the other, I'm going to put in a short post today.
Post-take over Taco Funds
My last recipe (July 7) concerned itself with buying companies after a takeover was announced. I thought that was my own idea but Mario Gabelli beat me to it by only fifteen years. Apparently he has two funds that operate according to this strategy. The first is the Gabelli ABC Fund (GABCX), so named because the strategy is as easy as ABC. The second is the AXA Mergers & Acquisitions Fund (EMAAX) which has only been around since 2002. It's a bit riskier than the ABC because it can also invest in potential take-over targets. There are two other funds in this space (that I know of): the Merger Fund (MERFX) and the Arbitrage Fund (ARBFX). Compared with these two, the Gabelli Funds have the lower expense ratios combined with higher returns, although they do require a higher initial investment ($10,000 for the ABC Fund compared with $2000 for the Merger Fund). In fact, the ABC Fund has never had an unprofitable year.
The Upside
A major upside is that these funds outperform the S&P during bear markets. For example, in 2000 the ABC Fund returned 10.7% while the Vanguard Index 500 Fund (VFINX) that mirrors the S&P returned a dismal -9.1%. These funds have a bear market decile ranking of 1 which means that they outperform 90% of the fund universe in recessionary markets. Now these funds don't boast stellar returns (ten year average of the ABC Fund is 6.7%) but their other selling point is their low risk making them very safe investments.
The Downside
The downside to these funds is pretty obvious. The S&P clobbers them during bull markets. Also, a souring economy can stem the takeover tide. When M&A activity dries up, Gabelli stuffs fund cash into T-bills so at least the investor is getting that rate of return. However, the falling dollar hasn't stopped global M&A activity, with foreign companies eying the relatively cheap American valuations. (Witness InBev's recent takeover of Anheuser-Busch.)
All-in-all, if you don't know where to park your money and you want a better return than cash during bear markets, these funds could be for you. Based on fees and returns, the Gabelli ABC Fund would be my choice. If you have the time and would rather pick and choose your own stocks, review Recipe #13 as well as my April 29 and 30 blogs. For a current example, look at Community Bankshares (SCB) which I highlighted in the June 26 blog as potentially sporting a return of over 12% in six months (24% annual return).
There. I'm done. I hope the angel on my shoulder is satisfied 'cause I'm treating the little devil to an afternoon off.
Everyone needs the occasional day at the beach.
Wednesday, July 16, 2008
Chip Dip
A strange day in the market, what with the airlines, financials, and Detroit automakers all operating in the green. The other head-scratcher are the semis--the silicon chip variety as opposed to the trucking kind. Looking at the chip makers, there are very few that are in the red. What's going on here?
Well for starters, Intel late yesterday reported its second-quarter profit climbed 25 percent, helped by strong sales of laptop processors. The Street took this as a good sign for investors wary of possible slowing PC demand. An analyst at Deutsche Bank reiterated his Buy rating and set a $26 price target. Although the news was good, it didn't have a drastic effect on the stock which rose today by only 1%. In contrast, shares of Altera (ALTR) gapped up by over 12% this morning on news that its second-quarter income jumped almost 22% due to higher sales and improved margins. Comparing the two charts, Altera's is much more exciting than Intel's, and that would be my pick of two. The chart shows resistance at $24 which is 10% above its current $21.65 price.
My Chip Pix
It's the general consensus of industry analysts that the chip makers will fare much better in the second half of this year, the only caveat being that the consumer can't close her pocketbook. In the past, computer sales were driven by corporate infrastructure; now, sales are much more consumer dependent. There's been plenty of jawing recently about which chip makers will fare the best based on fundamentals. If you're interested in getting in on this sector (and now could be an excellent time), I'll leave fundamental analysis to you. Besides, you should be doing this type of research anyway. Listen to Cramer!
Okay. I'll stop shaking my finger. Based purely on chartology, here are my candidates for Technical Best of Breed (TBB).
The Blue Ribbon Winners
Altera (ALTR) is my top chip choice and frankly there aren't a whole lot of dazzling candidates, at least for now. But things are starting to look up. Broadcom (BRCM) has recovered nicely from its multi-year low, gaining over 75% since March. It's been range-bound for the past several months and is nudging up against major resistance at $30. It reports earnings after the bell on July 22nd and if investors like what they hear, a jump above $30 could make for clear sailing to the next resistance level at $36.
The Runners-up
The following aren't my top choices, but they're performing well in the “Sporting Compelling Charts” category. Included are their current prices, expected earnings dates, and earnings estimates. (A denotes after-the-bell and U is unconfirmed.)
Flextronics (FLEX): $9.20. Earnings 7/24. Earnings estimate: $0.28
Skyworks (SWKS): $10.30. Earnings 7/17 A. Earnings estimate: $0.17
National Semi (NSM): $21.30. Earnings 9/5. Earnings estimate: $0.34
QLogic (QLGC): $16.30. Earnings 7/21 A. Earnings estimate: $0.29
SatCon Technologies (SATC): $2.80. Earnings 8/04 U. Earnings estimate: -$0.07
Silicon Storage (SSTI): $3.20. Earnings 7/29. Earnings estimate: -$0.09
Sun Chips
I can't conclude a discussion of the semis without at least paying lip service to the solar guys.This group has gotten bruised along with their less exotic brethren, but even they too are starting to turn up. If you like channeling stocks, look at Evergreen Solar (ESLR) and First Solar (FSLR). Rangebound as they have been, if this group does well, expect them to break overhead resistance. Trina Solar (TSL) jumped by a whopping 12% today off major support. Other stocks with bullishly biased charts are JA Solar (JASO), SunPower (SPWR), and LDK Solar (LDK).
Other ways to dip into chips
If you're still a tad wary of picking individual stocks you can buy the SMH which is the Semiconductor ETF. The stock is bouncing off $28 major support and could be heading back towards resistance at $34. Another way to play it involves options. Yes, I know you might not want to risk playing options in this sector because who knows? If the Grinch steals Christmas this year, chip profits will definitely suffer (along with everyone else's). But there is a way to cover your butt and your profits. Assuming the stock in question is optionable, you can purchase calls on the stock and simultaneously buy puts on the SMH. The SMH puts are your hedge against downside risk.
Conclusion
As I said, I don't know if the chips are going to amount to more than a hill of beans in the upcoming months, but if they do, now is the time to get in on the action. Remember, if you're heavily weighted in only a few sectors, it's always a good idea to diversify your holdings especially when a promising opportunity arises. Considering today's winning sectors, I'd much rather risk diversifying into the chips than into the airlines, financials, or auto makers. (I do think, though, that when we can see the clouds clearing over the credit crisis that financials will be looking mighty attractive, but I don't think right now is the right time.)
Note on today's market action: Although the market seems like it put in a bottom yesterday, I believe this to be another bear trap. I think we need complete capitulation before a true reversal can take place and that won't happen until the VIX hits the 35 mark. That's my tune and I'm stickin' to it!
Tuesday, July 15, 2008
VIX Plays
Yesterday we delved into the mysteries of the VIX looking at it from an historical perspective and what it portends for the market. I also tossed in my two cents concerning ways to play the market when the VIX hits various levels, saying that a rise above 30 generally signals that a market turnaround (even if it's a short-lived one) is imminent. Well, earlier this morning the VIX did rise above 30. As of this writing (about an hour before market close), the major market indices look to be forming bottoming tails--another tell-tale signal of market reversal. So, the question of the day is: how can we make a quick buck from a market reversal? Let's review some of our options.
The Set-Up
Being a scientist and mathematician at heart, my favorite intellectual pastime is to play variations on a theme of “What if?” Today's hypothesis goes like this: “Let's suppose the market will turnaround, either tomorrow or in a few days. How can we best profit from an upturn?” Well, we can either buy index tracking stocks such as the Diamonds, the Spiders, or the Qs; we can employ some sort of bullish index option strategy such as buying long calls, selling puts, or putting on bullish spreads; or we can use the reverse options strategies on the VIX which also has liquid options. To guide us towards the correct answer (or answers), we need to look at what would have happened in previous similar scenarios. In science, the more data you have the more accurate your results, but since I don't have a staff of lackeys to cater to my every whim, I'll have to make do with selecting one previous scenario, and the one that I've selected is the last one when the VIX hit 35 on March 17th. This was also the day the S&P 500 (as well as other major markets) put in a bottom and reversed course for the next two months. Now two months is a relatively long time for a bear market rally. Going back further to the previous two VIX 35 events that occurred last August and this January, you'll see that the market corrected for only a week to ten days. So, what I'm going to do is use seven trading days (weekends not included) as my holding period.
Stocks or Options?
For simplicity, let's look at the following scenarios:
1. Buying the tracking stocks on the Dow, the S&P 500, and the Nasdaq 100: DIA, SPY, & QQQQ
2. Buying call options on the above tracking stocks
3. Buying puts on the VIX
That's the setup. The following table shows the results.
[Note: Commissions are not included. End of day prices were used. Annualized returns based on 251 trading days (this is accurate to within a day or two. I'm too lazy to count the number of trading days this year.)]

Conclusion
I know I've gone through a similar exercise before but I wanted to do this again to see how put options on the VIX would compare and you can see that the results aren't nearly as good as using call options on the tracking stocks. It seems that you'll get the most bang for your buck by playing the Qs, either by buying the stock or the at-the-money options. Remember, too, that there's more leverage involved with options meaning that you don't need nearly as much capital to make a similar return. (See the example below.*) So, if you're interested in potentially making a quick buck, set an alert for when the VIX hits 35 and enter your play. Just remember to exit within a week or so if you're using short-term options as any longer than that and you'll start losing money due to time decay.
Viva la Vix!
*Example: Options vs. Stocks--The advantage of leverage
Let's say we have $1000 to make a trade. Using the data for the Qs in the above example yields the following results (assuming no commission costs):
Stock (QQQQ)
Initial cost on 3/17: 24 shares x $41.48 = $996
Sell price on 3/26: 24 x $44.70 = $1073
Net Profit: $77
Option (QQQQ June41 Call)
Initial cost on 3/17: 3 contracts x $3.19 = $957
Sell price on 3/26: 3 contracts x $5.14 = $1542
Net Profit: $585
You can see that options return more than seven times that of the stock.
Monday, July 14, 2008
The VIX, the Market, and the Investor
I know this title sounds like it could be a Chronicles of Narnia sequel, but the relationship between the VIX and the market is more than just a fairytale. You've heard me mention that the VIX is the volatility index, but exactly what is it and what does it tell us? Technically, the VIX is the measure of volatility on the S&P 500. It's an invention of the CBOE (Chicago Board of Options Exchange) along with their other volatility products that cover these benchmark indices: Dow Industrials-VXD, the Nasdaq 100-VXN, the S&P 100-VXO, and the Russell 2000-RVX. (Note: There's also a volatility index on crude oil, the OVX.) The VIX and its brethren reflect the market's expectation of 30 day volatility and are constructed using the implied volatilities of calls and puts on a wide variety of near-term index options. Just like the standard deviation of a rate of return, the VIX is quoted in percentage points. As of this writing, the VIX is trading at 28.81, a relatively high value.
The Vix and the market
The VIX is regarded as a leading barometer of investor sentiment and inherent market risk. It is negatively correlated* to the S&P 500, meaning that if the VIX moves higher, the S&P will move correspondingly lower. The monthly chart of the VIX and the S&P below shows this to indeed be the case. You can see that during bull markets, the VIX stays low. The 90's bull market was marked by a VIX that stayed in the low 20s. The latest bull run from 2003-2007 had VIX values in the 10 to 15 range. Why the difference? Pre-2003 the CBOE derived the VIX from the implied volatilities of only eight at-the-money put and call options on the S&P 100. Since then, the VIX has expanded to use more options based on the S&P 500. This allows for a more accurate view of investors' expectations on future market volatility which is reflected in the chart.


Several years ago, the CBOE began offering options on the VIX. (There are VIX futures, too.) The options are liquid but they're also volatile. Used appropriately, they can reduce portfolio risk while maintaining returns. (For further info click on the CBOE link below.) This is their conservative side. If you have a speculative streak, you can play them as you would any other option but I'd be extremely careful; the implied volatility on these options can be high. In other words, the volatility index is a volatile index. Buying puts at extreme highs could land you a tidy return in a very short amount of time. I haven't done this so I can't put the Dr. Kris seal of approval on it, but next time the VIX heads north of 30 (which it's threatening to do any minute), I might just take on a small position and see how it works out.
VIX Strategies
You may wish to take note of the following strategies based on VIX movement:
Falling below 20: Start covering short positions and bias your portfolio towards the long side. As the VIX drops, keep adding to long positions.
Staying below 15: Utilize all bullish strategies, including more aggressive plays.
Rising above 15: Use covered calls to protect long positions. Wait until the VIX falls below 15 before initiating new long positions.
Rising above 20: Start unwinding aggressive positions. Collar long stocks if you're planning on keeping them. Start buying stock or index puts. (Can also buy VIX calls as another portfolio hedge.) If VIX remains above 20, lighten up on long positions.
Rising above 25: Cash out of long positions if possible or fully protect the ones you keep. Enter short positions or buy Contra ETFs.
Rising above 30: If you have short positions, starting writing covered puts.
Near or above 35: The market is ready to capitulate. Speculators can buy index calls or VIX puts. You'll have to be on your toes to catch this one as the VIX kisses this level for only a moment.
What is the VIX telling us now?
The above chart shows that the market doesn't turn around until the VIX reaches the mid-30s (typically 35). The VIX hasn't even reached 30 which to Dr. Kris's eyes means continued market decline.
Summary
I hope I've given you a better picture of the VIX. Unlike the wardrobe in the Chronicles of Narnia, there's no magic behind it except in how you use it and for that, the wand to make your portfolio returns grow is in your hands. May the power of the VIX be with you!
*The CBOE lists the VIX/SPX correlation coefficient at -0.86 (current as of June 2007) which is a high measure of negative correlation. (+1 is perfect positive correlation; -1 is perfect negative correlation; and 0 is no correlation)
Reference: Using VIX options to reduce portfolio risk: http://www.cboe.com/micro/volatility/introduction.aspx
The Vix and the market
The VIX is regarded as a leading barometer of investor sentiment and inherent market risk. It is negatively correlated* to the S&P 500, meaning that if the VIX moves higher, the S&P will move correspondingly lower. The monthly chart of the VIX and the S&P below shows this to indeed be the case. You can see that during bull markets, the VIX stays low. The 90's bull market was marked by a VIX that stayed in the low 20s. The latest bull run from 2003-2007 had VIX values in the 10 to 15 range. Why the difference? Pre-2003 the CBOE derived the VIX from the implied volatilities of only eight at-the-money put and call options on the S&P 100. Since then, the VIX has expanded to use more options based on the S&P 500. This allows for a more accurate view of investors' expectations on future market volatility which is reflected in the chart.

How to use the VIX
Okay, so now you know what the VIX is and what it represents. But how can you, the investor, take advantage of it? For one, you can use it as a strategy guide for your own investing. For example, last July the VIX broke through its upper level resistance of 20 and stayed there. What the VIX was telling us was that people were starting to get jittery. That was the time to lighten up on long positions and start using protective strategies such as stock and index puts. Since then, the market tumbled while the VIX rode higher. The chart below shows the VIX making a series of higher highs and higher lows, with each low bouncing off its 20dma (not shown in the chart). The lows formed a perfect trend line that was subsequently broken on April 1st when the market reversed course and began heading up. But unfortunately, the rally was short-lived. The VIX traded below 20 for a month before it turned back up trading through the 20 mark at the beginning of June. And as we well know, the market has been skidding downhill since.
Okay, so now you know what the VIX is and what it represents. But how can you, the investor, take advantage of it? For one, you can use it as a strategy guide for your own investing. For example, last July the VIX broke through its upper level resistance of 20 and stayed there. What the VIX was telling us was that people were starting to get jittery. That was the time to lighten up on long positions and start using protective strategies such as stock and index puts. Since then, the market tumbled while the VIX rode higher. The chart below shows the VIX making a series of higher highs and higher lows, with each low bouncing off its 20dma (not shown in the chart). The lows formed a perfect trend line that was subsequently broken on April 1st when the market reversed course and began heading up. But unfortunately, the rally was short-lived. The VIX traded below 20 for a month before it turned back up trading through the 20 mark at the beginning of June. And as we well know, the market has been skidding downhill since.

Several years ago, the CBOE began offering options on the VIX. (There are VIX futures, too.) The options are liquid but they're also volatile. Used appropriately, they can reduce portfolio risk while maintaining returns. (For further info click on the CBOE link below.) This is their conservative side. If you have a speculative streak, you can play them as you would any other option but I'd be extremely careful; the implied volatility on these options can be high. In other words, the volatility index is a volatile index. Buying puts at extreme highs could land you a tidy return in a very short amount of time. I haven't done this so I can't put the Dr. Kris seal of approval on it, but next time the VIX heads north of 30 (which it's threatening to do any minute), I might just take on a small position and see how it works out.
VIX Strategies
You may wish to take note of the following strategies based on VIX movement:
Falling below 20: Start covering short positions and bias your portfolio towards the long side. As the VIX drops, keep adding to long positions.
Staying below 15: Utilize all bullish strategies, including more aggressive plays.
Rising above 15: Use covered calls to protect long positions. Wait until the VIX falls below 15 before initiating new long positions.
Rising above 20: Start unwinding aggressive positions. Collar long stocks if you're planning on keeping them. Start buying stock or index puts. (Can also buy VIX calls as another portfolio hedge.) If VIX remains above 20, lighten up on long positions.
Rising above 25: Cash out of long positions if possible or fully protect the ones you keep. Enter short positions or buy Contra ETFs.
Rising above 30: If you have short positions, starting writing covered puts.
Near or above 35: The market is ready to capitulate. Speculators can buy index calls or VIX puts. You'll have to be on your toes to catch this one as the VIX kisses this level for only a moment.
What is the VIX telling us now?
The above chart shows that the market doesn't turn around until the VIX reaches the mid-30s (typically 35). The VIX hasn't even reached 30 which to Dr. Kris's eyes means continued market decline.
Summary
I hope I've given you a better picture of the VIX. Unlike the wardrobe in the Chronicles of Narnia, there's no magic behind it except in how you use it and for that, the wand to make your portfolio returns grow is in your hands. May the power of the VIX be with you!
*The CBOE lists the VIX/SPX correlation coefficient at -0.86 (current as of June 2007) which is a high measure of negative correlation. (+1 is perfect positive correlation; -1 is perfect negative correlation; and 0 is no correlation)
Reference: Using VIX options to reduce portfolio risk: http://www.cboe.com/micro/volatility/introduction.aspx
Friday, July 11, 2008
Earnings Etouffe Redux
My very first recipe was Earnings Etouffe. In a nutshell, the strategy is simply to buy stocks that have raised their earnings guidance and sell them just before their next earnings release. In my April 7th blog, I mentioned 15 stocks that had raised estimates that I thought would be good candidates for this recipe. Since second quarter earnings season has just kicked off, I thought I'd go back to these stocks and see how well they would have performed.
Portfolio construction
The First Quarter Earnings Etouffe Portfolios were constructed according to the following parameters:
1. $5000 per position, giving a total portfolio value of $75,000 (15 stocks x $5000)
2. No margin was used; account interest of 2.5% paid quarterly
3. All transactions reflect end of day prices
4. $9.95 commission/trade (no other fees included)
5. Thirteen stocks were purchased on 4/7/08; MANT was purchased on 4/15 due to volatility and FCN was bought on 4/16 when it bounced off of support. (I mentioned both of these issues in the April 7th blog.).
6. Stocks were sold according to two scenarios:
Scenario #1: Stocks were sold just before their earnings were released. (This is according to the Earnings Etouffe recipe.)
Scenario #2: Stocks were held over earnings and sold on or after the date of release, depending on the time. (Companies reporting before the bell were sold at that day's market close; those reporting after the bell were sold at the close of the following day.)

Comparison of the two scenarios So, how did these two portfolios perform? Porfolio #1, the one where stocks were sold just before earnings, gained 3.5% (18% annualized return), while Portfolio #2 in which stocks were held over earnings gained only 2.3% (14% annualized return). What's interesting to note is that the field was evenly divided: 7 stocks fared better after earnings, 7 fared worse, while one essentially remained the same (FTD) . (See table) Although the percentage is even, the results obviously weren't. Two stocks, VVI and ASTE, dropped significantly which contributed to the underperformance of the second scenario. Now fifteen stocks is by no means a representative sampling but it still illustrates my point of selling before earnings.
Comparison with the S&P 500
Compared with each other, Portfolio #1 outperformed #2, but they both outperformed the S&P from April 7 - June 17. During that time, the benchmark index was down 1.6%. From this it seems that the tenets of this recipe are valid even in times of market decline. So if you're interested in playing this strategy, now is a good time to familiarize yourself with Recipe #1 and go stock hunting. Don't forget that you also have the option of using options, thereby increasing returns. There's still plenty of time to get in on this earnings season. Good luck and happy weekending!
Thursday, July 10, 2008
Sexy Biotechs
For the past two days we've been judging best of breed among the drug sector. Tuesday's lineup included the Wholesale/Distributors and Generic drug makers. We found several decent plays but there was little else that warranted more than a passing yawn. The excitement quotient picked up yesterday with some attractive candidates lurking in the Ethical Drug industry (Big Pharma), and today's contest portends to be even better because on tap is the sexiest group of them all, the Biotechs.
The Lineup
There are hundreds of companies in the Biotech group ranging in size from micro- to large-cap with an estimated majority falling near the lower end of the scale. I looked at the chart of every single one and am happy to report that the most attractive stocks were found among the large-caps, although I did find a couple of decent small-cap stocks and one micro-cap. Okay, enough of the introduction and on with the show.
The Beauty Queens
Winning in all departments (including the much-dreaded talent portion of the beauty contest) are the following:
Illumina (ILMN): 5000% is how much this stock has gained in the past five years. But is it too pricey now that it's trading just under $90? Maybe. It's P/E ratio is catching up to its growth rate. For now, the company is slightly undervalued but it won't be if the price goes much higher. However, the company said recently that it expects second quarter profit of 37 to 40 cents per share, topping the 28 cents expected by analysts. Perhaps this good news is being priced into the stock...? All I know is that the Chicken Little in me would wait until after their next earnings announcement on July 22nd before deciding whether or not to jump in.
Celgene (CELG): This stock took a tumble along with the rest of the market last October. It bottomed out in December (earlier than most) and has been rising steadily since. Poor drug trials by a competitive product have helped the company's bottom line. At $71/share, it's closing in on its all-time high of $75 and change. I'd look to buy it here. Note that an analyst at Jeffries just raised company EPS estimates as well as the target price from $77 to $81 per share.
Techne (TECH): This company develops, manufactures, and markets instruments and other products for use in biotechnology and hematology world-wide. It's revenue, earnings per share (EPS), and EPS growth rate have been increasing steadily along with its share price. The deca-levels ($10 levels) seem to form resistance for the stock. It cleared the $70 hurdle a couple of months ago and is now looking to take-out the $80 level. If it does that on volume conviction, I'd be a buyer. Earnings aren't until Aug.5, but if it reports much better than expected results like it did on April 29th, you could see the stock leap well over the $80 mark, if it hasn't surpassed it by then.
Emergent Biosolution (EBS): This is one of the small-cap companies I mentioned above. It develops and manufactures vaccines for a wide variety of applications including anthrax, an agent of bioterrorism. The stock plummeted from a high of $17.75 to under $5 last December. It dug itself out of the trench and is now trading at $12. The company is currently involved in a he-said-she-said type of lawsuit which doesn't seem to be affecting the stock price. A good entry point would be a bounce off its 50dma. Earnings will be reported later in August.
Savient Pharmaceuticals (SVNT): Since 1995, this stock has steadily risen from under $2 to a high of over $28 per share. It's now trading about a buck below the high; breaking that level would be a bullish sign. It's gout treatment posted positive phase III clinical trial results which sent Wall Street pundits into takeover speculation mode as this treatment has dollar signs written all over it. (See my note below regarding takeovers in this sector.) The company has not announced the date of its next earnings release but if it's like years past, it'll be somewhere late in July or early in August.
CombiMatrix (CBMX): This may be the smallest of the companies promulgated here, but it wins the bathing suit contest hands-down. The company fabricates material arrays, including DNA microarrays, which are used in a variety of applications. It is also involved in biodefense and nanomaterials development. Can this company stuff a wild bikini or what?! Although its sales are comparatively small, its growth rate has been enormous. It was recently added to the Russell Microcap Index. The stock is having a tough time staying above $11 and if it can do that, I'll be a buyer. Earnings are scheduled for late July or early August. Also, please keep in mind that the average daily volume on this stock is only 20,000 shares, so use limit orders when entering trades.
The Runners Up
Here's a list of more good companies that didn't quite make the grade, either because they're trading off their highs or are in the process of recovery. For one reason or another, their charts weren't as compelling as the ones above. You'll have to do your own research on these since I don't have the time nor the space, but for what it's worth, the MSN Stock Scouter gave them all an 8 (out of 10) which is very good and my investment software rated them all a “Buy" except for Gilead and Martek which were rated as “Holds.” In no particular order, here are the runners up: Myriad Genetics (MYGN), Martek Biosciences (MATK), Gilead Sciences (GILD), ViroPharma (VPHM), Onyx Pharmaceuticals (ONXX), and Alexion Pharmaceuticals (ALXN). Genzyme (GENZ) almost made the cut but I'm not quite sure if the stock's current rally is for real or just a head-fake. I'd like to see it break its $82 high first. As a consolation prize it's awarded Miss Congeniality.
Summary
Well, now you've got a nice list of drug stocks to add to your buy list. One thing I noticed in my perusal of this sector is the inordinate number of recent takeovers. Considering the large quantity of companies in this sector, it's not unreasonaable to expect a certain amount of consolidation, what with many of the major drug developers cutting costs as their key revenue drivers lose patent protection and face stiff competition from generic equivalents. With increasingly lackluster offerings, big pharma is turning to biotechs to help them beef-up their product pipelines. Of course, one could always play the take-over game by trying to identify those companies prime for the picking, but considering the sheer number of drug stocks in the micro-cap universe, that seems almost as impossible as pushing an elephant through a keyhole.
Frankly, I can think of better things to do.
Wednesday, July 9, 2008
The "Ethical" Drug Stock Pix (aka Big Pharma)
Yesterday we looked at the ugly ducklings comprising the wholesale/distributor and generic segments of the drug sector and found little to recommend. Today will be a different story as there are many beaten down companies that deserve our attention. I mentioned that before yesterday, the drug sector had been on a stealth rise and was perched in the number 12 spot. Because of yesterday's across the board gains, the sector not only made the Top 10 list but the Top 5 list as well. Yep. It's now Number 5 with a bullet. I can't guess how much higher it can go--trying to topple the utilities and petroleum sectors will be no small feat. But the drug sector isn't the only one that has done well as of late; so has its partner, the healthcare sector, which is currently sitting in the number four spot. (FYI, the Market sector composed of long and short ETFs holds the number three position.) Healthcare is a subject best left for another time for today we're going to be judging the best of breed in one of the other two remaining drug sector industries: the Ethical drug makers (don't ask me how the term “ethical” came to denote big pharma). Biotechs, the last industry, is left for tomorrow.
The Beautiful Swans, Part I: The “Ethical” Drug Makers
This industry covers most of the major drug makers and it also includes some of the smaller ones. First on the list is Vivus (VVUS). This stock was a darling ten years ago when it was trading over $40/share. The company develops and markets sexual dysfunction drugs for both men and women. In 1997, it came out with Muse, an erectile dysfunction drug. A short time later, Pfizer introduced Viagra which not only killed the market for Muse but for the stock, too. In just one year, Vivus lost over 90% of its value, trading under $3. However, since the middle of 1995 its been upward bound and is now trading just over $8. Its Qnexa drug is in stage III clinical trials for obesity and in stage II trials for diabetes. The results look promising. They also have a couple of other sexual dysfunction drugs in clinical trials and recently sold a menopause treatment to K-V Pharmaceuticals in May, 2007 which gave the stock a nice boost on the behind. Today, it's looking a tad overextended; I'd wait for a pull-back before placing my chips on the table. One cause for concern is that insiders have been selling quite a bit of stock over the past year. Is there something they know that we don't?
After losing nearly 50% of its value since fall 2006, AstraZeneca (AZN) made an about-face in the middle of March and is now trading at $48, nearly 37% above that low. This is one darn fine company, rated a 10 by the MSN Money Stock Scouter. Among many of its successful and lucrative products include the highly publicized Nexium and Crestor. The stock recently broke above its 50dma on a weekly chart--a positive technical event that signals a continued rise in price. Another good sign is that the company has been steadily increasing its dividend which now stands at $1.82 annually for a 3.9% dividend yield.
Other stocks that are rising from the ashes are Schering-Plough (SGP), King Pharmaceuticals (KG), and Novartis (NVS). I like the price action on the first two but am a bit hesitant about recommending Novartis. Sure, its price has increased by nearly 24% in the past several months but this is exactly the reason I'm being standoffish--at least for the moment. Its chart is looking toppy and I'd like to see it take a break before entering a trade. The other two companies have been steady eddies, and their consistent price pattern is something I find more reassuring. Schering blew out last quarter's estimates and is reporting good phase III test results with its hair follicle stimulating drug. King Pharmaceuticals is recovering from a two-year low. It recently broke heavy resistance at $10 and is rising steadily. The fundamentals on this company seem to be lackluster, but they did beat analysts' estimates for the past two quarters. I'm recommending this stock purely on the basis of its chart action.
There are three other stocks here that have been doing exceptionally well: Elan (ELN), Wyeth (WYE), and Valent (VRX). The reason that I'm not giving them two thumbs up is that they all look over-extended and are likely due for a breather, but I'd keep them on a watch list.
Summary
My plan for today was to include the biotechs but there are literally hundreds of companies in this group and it's taking me much longer to analyze than I had expected. Tomorrow I promise this will all be wrapped up, but you won't be disappointed 'cause there's quite a few sexies in the lineup.
Trading Note: I'm seeing large topping tails on the the PPH and the BBH (the pharmaceutical and biotech ETFs) and in many of the drug stock charts. This generally bodes ill for continued upward movement in the short-term. Keep this in mind if you're looking to buy either the ETFs or some of the underlying stocks. Patience, in this case, is a virtue and will ultimately be rewarded.
Tuesday, July 8, 2008
A Shot in the Arm or Another Bear Trap?
Who pushed oil and commodities off their lofty ledge? Hello! Is NOTHING sacred??? Geesh! Just when you think you've got this market all figured out...Is there nothing left to buy?
Maybe. There is one sector that has been rising stealthily, unseen beneath the blinding curtain of the falling dollar and rising energy and commodity prices. Just last week, this sector was 30th in the rankings but as of yesterday, it's now perched in the twelfth position. And if today's action is any indication, it could break into the Top 10 tomorrow. What is this sector? No, unfortunately it's not the financials--yet. It's another beaten down sector, the drug stocks.
The case for drugs
The chart of the PPH, the Pharmaceuticals Holder (an ETF), shows that it's up 4% over its multi-year low at $66.50, a number that it hit three days ago. But it has three resistance levels at $72.50, $75.50, and $77.50 to clear before I'd be a firm believer. The Biotech Holders, the BBH, paints a rather different picture. Sure, the daily chart has been trending up for the past six weeks, but if you look at the weekly and monthly charts, the forecast may not be as rosy. The stock has declining steadily since 2005, and the pennant that it's now forming can be construed as a bearish sign. Just to be on the safe side, I would personally wait until the price cleared $182 before I put on full positions in the biotechs.
The four major industries
I have no idea if this sector rally will hold, but it's worth a look just in case. What I'm going to do is to pick what I feel are the most compelling stocks in each of the sector's four industry groups: the Generic drug makers, the Ethical drug makers (the large-cap pharmaceutical companies are in this group), the Biotechs, and the Wholesale/Distributors. These groups are composed of many companies and to try to include them all in one blog is too much for me as I'm perenially short-staffed. So, the plan is to tackle the ugly ducklings today and leave the beautiful swans to tomorrow.
The Ugly Ducklings
The Wholesale/Distributors
This is the least compelling group of them all. In fact, with the exception of one stock, it's downright fugly. The two major names here are Amerisource Bergen (ABC) and Cardinal Health (CAH). Both are down over 30% from their recent highs and both are sitting at major support. McKesson (MCK) is the other major player. Its near 4% gain today is but a small step in the right direction. It's going to have to break $60 for me to even consider it. No, the only compelling stock here is Owens and Minor (OMI). The stock has risen almost 70% in two years and the bounce off of its $44 support yesterday combined with a nice gain today signals that a break to new highs could be in the offing. The company is in good financial shape, too. Zacks recently included it as part of its Discounted Fundamental Strength strategy which identifies stocks with strong fundamentals and low valuations. As an added plus, the company pays a dividend (current D/Y is 1.7%).
The Generics
This is another small group and only slightly better looking than the above. The biggest names look to be the most compelling. Teva Pharmaceuticals (TEVA) tops the list. Despite a disappointing trial result for its MS drug yesterday, it was upgraded today by a Goldman Sachs analyst. This left me scratching my head until I saw that Goldman owns 8.5 million shares of the company's stock. Okay. Now that makes sense. Chart-wise, the stock has been sliding away from its all-time high of $50 put in several months ago. It's currently bouncing off support and if it manages to keep moving in a positive direction, I'd hold onto it at least until it retests its high. On the other hand, if it continues in the downward direction, I'd dump it if it breaks below $42.
Nothing else in this space warrants a buy recommendation (and TEVA barely gets that). The “not-as-ugly-as-the-others” awards go to Perrigo (PRGO), Barr Pharma (BRL), Watson Pharmaceuticals (WPI), and Mylan (MYL). All have recently been trending up but hey, so have a lot of other stocks. There's nothing in this sector to get excited about at the moment.
Summary
Now that we've cleared the stage of the coyote uglies, we've got room for the real lookers--the biotechs and big pharma which we'll be judging tomorrow. 'Til then!
Thursday, July 3, 2008
Handy-Dandy Financial Resources
For those of you who are “staycationing” over the Fourth and find yourself with way too much time on your hands, here's a short list of some financial websites that I use regularly for research and information that you might like to peruse. Now, most folks rely on one of the more common, comprehensive sites as their primary source of financial information such as Yahoo! Finance and MSN Money Central, but there are other sites that provide niche products that these don't. Since this is a holiday-shortened market day, Dr. Kris & Co. is taking off early. So without further ado, here are the sites that I find useful along with a few brief highlights.
The Do-All/Go-To Sites
The following sites offer a variety of resources, tools, and (mostly) free services: business news, stock charts, market stats, company descriptions, mutual fund/ETF/bonds/currency centers, earnings events and economic calendars, SEC filings, insider trading, analyst upgrades/downgrades, stock screeners, financial blogs, investment newsletters, email alerts, streaming financial videos, educational tools on all aspects of investing (including options) and personal finance including calculators and portfolio trackers. And the list goes on and on. You can easily spend several hours if not the better part of a day just getting to know one of these. Of the sites below, Yahoo! and MSN are the most comprehensive.
Yahoo! Finance: http://finance.yahoo.com/
They have a new feature called Tech Ticker that is basically one big blog along with streaming video clips.
MSN Money Central: http://moneycentral.msn.com/home.asp
Offers a stock screener and email alerts that Yahoo! doesn't.
Google Finance: http://finance.google.com/finance
This site isn't nearly as comprehensive as the other two which may be a big plus for you "less is more" type folk.
CNBC.com: http://www.cnbc.com/
You can enter their over-hyped contests from here.
Zacks.com: http://www.zacks.com/
Offers a nifty free screening tool plus two weeks free use of their research wizard. (Note: Some of their stock screens are subscription only.)
The Niche Sites
These are a few of the sites that I use to find specific info fast.
Full Disclosure (now Earnings.com): http://www.fulldisclosure.com/
Bare-bones site featuring economic highlights, previous and upcoming earnings estimates and results for all listed companies, earnings/conference call/splits/dividend/economic events calendars. I use this site all the time.
Street Authority.com: http://www.streetauthority.com/default.asp
Good investor education tools including a comprehensive financial dictionary, a description of each market index, and a free options course.
Morningstar.com: http://www.morningstar.com/
The Uber-Site for ETFs and mutual funds. They also offer in-depth reports on over 6000 hedge funds. It's by subscription but there's a two week free trial.
TheStreet.com: http://www.thestreet.com/
Have some fun in the financial horoscope section which includes celebrity horoscopes and a money matchmaker.
Options Sites
The CBOE offers free online options tutorials and courses and is the place to go for options pricing and everything else options-related. The OIC also offers free options classes as well as downloadable options software. Both links are at the top of the page.
Summary
The above sites are just the tip of the financial information iceberg. If you've always wanted to learn options, this weekend would be a great time to sit in front of your air conditioner with the baseball game in the background and your computer tuned into an online options course. I just may do that myself and brush up on a few strategies...or I just might lie on the beach and read.
Have a safe and fun Fourth!
Wednesday, July 2, 2008
Five More Tasty UltraShort ETFs
In yesterday's blog I mentioned five ultrashort ETFs that look especially compelling under current market conditions. However, I feel that five just isn't enough choice for a hungry bear so I'm introducing five more that I find particularly attractive. But beware! One of them is the ultrashort basic materials fund that has leapt up 10% just today. What this means is that if you want to buy it but are already holding some stocks in the materials sector, you'll be working at cross-purposes. To avoid being looked upon as a schizophrenic by your broker, this might be a good time to take your profits and exit your long positions.
Okay, here are today's picks.
More Ultrashort ETFs
(Note: Prices quoted are current at the time of writing.)
Materials (Ultrashort/Long): SMN($32.30)/XLB($40.) The materials sector has had a great run-up but has been running out of gas since May 19th, the bear market tipping point. The XLB broke major support a couple of days ago at $42 and is making a beeline for its next support line at $38. This translates into a 10% move in the SMN placing it right at its next resistance area at $35.
Semiconductors (Ultrashort/Long): SSG($68.80)/SMH($29.10) The semi's have dropped by 17% since mid-May and are heading down towards their major support level at $28. Assuming that happens, we can expect a corresponding 8% rise in the SSG to the $74-$75 region. Note that if the SMH breaks $28, there's no telling how much further it might drop since it'll be flying without any safety net, at least until the next support level at $20.
Russell 2000 (Ultrashort/Long): TWM($81.20)/IWM($67.75) The death knell for the Russell 2000 sounded on June 5th, a couple of weeks later than for the rest of the market. The IWM is sliding toward its next support level at about $64.50, and if it reaches that, the TWM will have gained roughly 10% to $89.
Emerging Markets (Ultrashort/Long): EEV($79.50)/EEM($132.) The long ETF, the EEM, has been an outstanding performer since its inception in 2003, chalking up a 380% gain at its October 2007 peak. Since then, it's been in a decline and put in what appeared to be a double bottom in January and March. But like most of the overall market, it rolled over on May 19th and appears to be heading towards its $126 support level. If it can accomplish that, the EEM will be on track to reach the $87 level for a 9% gain.
S&P Midcap 400 (Ultrashort/Long): MZZ($57.80)/MDY($146.70): The chart pattern for the S&P 400 is very similar to the that of the Russell 2000 (probably because they both are composed of smaller-cap stocks). The MDY peaked on June 5th. The next stop looks to be where it put in its double bottom in the $135 area. This will give us a target price of $67 on the MZZ for roughly a 16% gain.
From among these ten ETFs (including the five mentioned yesterday), even Papa, Mama, and Baby Bear should be able to find a few things that suit their palates. If you're finicky and don't like what you see here, there's plenty more tempting ultrashort funds on the menu, but please, no whining. Goldilocks is in no mood for grumbling!
FYI: I said yesterday that I didn't know how many ETFs are currently being offered. According to MSN Moneycentral, there are 742 funds on their ETF list.
Tuesday, July 1, 2008
UltraShort ETFs: Is there some play left?
This market has been especially frustrating for the traditionally long-focused investor, and as a favor to these types of folks who might be frightened about shorting stocks I thought I'd give them a chance to go long while taking advantage of the short side of things. How? By buying short-sighted ETFs allows one to effectively short an index by going long. As we've noted before, the ETF universe has exploded in recent years and there are literally hundreds (if not thousands?) of exchange traded funds that cover virtually every index imaginable--from niche industry groups to international markets, including emerging markets. The difference between a plain-wrap short ETF and an ultrashort one is leverage. Most ultrashort ETFs move twice as fast as their regular counterparts, thus enhancing returns. But of course, leverage is a double-edged sword as you can lose money faster, too, thus reaffirming the value of setting stop/losses. So what makes these ultrashort ETFs such an attractive investment strategy right now?
We're in a bear market. Get used to it.
As I've been mentioning for the past couple of weeks, the market has switched into bear mode with further downside not only possible but highly probable. Why do I say that? Because of the VIX, the volatility index. The VIX has been heading up for the past month and a half, passing from bullish to bearish in the beginning of June when it crossed the 20 level. Currently it's at 25, no where near its market capitulation level of 35 which it has touched several times in the past year. I firmly believe that we're not going to see any type of market correction until the VIX clears the 30 level at least. An increasing VIX puts further downward pressure on the market, and I don't think anything except for energy and perhaps materials stocks will be exempt from the carnage.
And that's why I think buying ultrashort ETFs is still a good move. But which ones?
The Ultrashort short list
As I mentioned above, apart from anything having to do with energy or materials (and perhaps a few other commodities), even a blind monkey could pick ultrashort ETFs that will make money. The field is that good, but the charts of some of them are more compelling than others. Here's a list of my favorite ultrashort candidates along with their long ETF counterparts for chart comparison. (Note that there can be more than one ultrashort fund per index. If there was a choice, I chose the more heavily traded fund.)
Technology (Ultrashort ETF/Long ETF): REW($64.50)/XLK($22.80). Major support on the XLK is at $20. This translates into over a 7% rise in the REW which is at $70. Major resistance is around $77 which is a 12 point move from current levels for an 18% return.
Dow Industrials (Ultrashort/Long): DXD($64.50)/DIA($113.60). The DXD made a new two-year high today. The next major stop for the DIA is at $110 which corresponds to roughly a 4 point move in the DXD (6% gain).
S&P 500 (Ultrashort/Long): SDS($66.90)/SPY($127.90). The S&P is currently sitting on minor support at 1280 (the SPY is at 128). If it breaks through this (and I think it will), the next support area is around 1235. Doing the math shows that the SDS is expected to reach close to its multi-year high of $72 for a 7% return.
Nasdaq 100 (Ultrashort/Long): QID($43.90)/QQQQ($45.75). The Q's broke support a couple of days ago and the next stop seems to be 42. If the Qs drop to that level means that we should expect the QID to reach $49.60 (or so) for a return of over 12%.
China (Xinhua China 25 Index) (Ultrashort/Long): FXP($85.90)/FXI($130.30). The FXP has already risen over 40% since the beginning of May. It's entering into a congestion area at 90 and if it can break through that, it may make a run to its old high of $120 which, coincidentally, is also a major support level for its long counterpart, the FXI. But even if the $120 support level holds for the FXI gives us a target price of around $99 for the FXP--a return of 15%.
Well, this is the short list. I didn't include the SKF, the financial ultrashort, which has already zoomed up 65% since May. Today's topping tail could signal a short-term decline, so I wouldn't jump in here just yet (if at all). I'm going to construct an equally weighted portfolio of these five ultrashort funds today and see how we do over the next couple of months. I have two target exit dates: 1. If the VIX rises above 30, my exit date will be the day it drops back below it, and 2. If the VIX never reaches 30, I'll exit the portfolio when it falls under 20.
It's good to have an escape plan.
Subscribe to:
Posts (Atom)

