
I just noticed that this will be my 300th post on Blogger, and while I've enjoyed my time here immensely my posts here will cease to exist. As of Monday, May 11, 2009 my blog can be found on my new website: www.stockmarketcookbook.com
Please make a note of this and if you have this site bookmarked, please change it to the above URL.
Many thanks to the folks at Blogger for providing me the means to get my word out and build a following. This is one quality product and I highly recommend it to anyone interested in making a foray into the blogosphere.
Adieu!
Sunday, May 10, 2009
Thursday, May 7, 2009
New website coming Monday!
**** FOR IMMEDIATE RELEASE ****
Dr. Kris, the founder of the financial blog StockMarketCookBook, today announced that her blog will be moving to her new website this coming Monday, May 11th. Besides her (almost) daily insights into current market trends, she will be introducing new and exciting financial products designed for both personal and professional use. More information on these will be provided as Monday approaches...

Dr. Kris, the founder of the financial blog StockMarketCookBook, today announced that her blog will be moving to her new website this coming Monday, May 11th. Besides her (almost) daily insights into current market trends, she will be introducing new and exciting financial products designed for both personal and professional use. More information on these will be provided as Monday approaches...

Tuesday, May 5, 2009
S&P resistance levels
Well, it seems as if a new bullish trend is developing. Today the VIX, the volatility index, closed under resistance at 33.50. The Nasdaq volatility index, the VXN, also broke resistance. The Dow Transports have remained above major resistance of 300 that it finally broke last week. This level is quickly turning into support.
So, assuming this bullish tenor holds and the results of the bank stress test are along the lines of what the Street is expecting, where do we go from here? A look at the chart of the S&P 500 below shows a minor resistance level at 935. If we can clear that, it looks like smooth sailing until major resistance at 1000.
Hope you have your buy lists ready!

Now back to my website...
Monday, May 4, 2009
Time to add dividend stocks to your portfolio
If you believe that we've already seen the bottom of the market and it has no where but to go up (or sideways at the worst), then you might be thinking that now would be a good time to start lining your larder with some high dividend-paying stocks. Why would you want to do this? For the following reasons:
1. Dividends account for most of the wealth accumulated in the stock market. And don't believe that dividend stocks are for income generation only—au contraire mon ami! In fact, if you're a young person just beginning to save for retirement (which you should be doing!!!!), adding some high-quality dividend-paying stocks to your portfolio is one of the wisest things you can do. Especially if you elect to re-invest your dividends into buying shares of your stock. This is a form of compounding, one of the most powerful methods of generating long-term wealth.
2. Buying dividend-paying stocks at depressed prices boosts your dividend yield because of the low cost basis.
3. Buying dividend stocks at depressed prices also gives you the added benefit of price appreciation.
To find stocks that have high dividends and with a good fundamentals, I ran a stock screen on the MSN Money Central Stock Screener (which is free to all and with whom I have no affiliation) according to the following criteria:
* Average daily volume greater than 100,000 shares. This ensures liquidity and a narrower bid/ask spread.
* Last price greater than $2. In bullish environments, this criteria could be raised, but I chose this value since many issues are so undervalued.
* Current dividend yield = As high as possible
* Stock Scouter rating greater than or equal to 7. This is an attempt to capture the higher quality issues.
I screened the top 50 stocks according to the bullish strength in their charts. (I know this is subjective but judging from today's action, this group is up on average over 3.5% as of this writing.) The following twenty-two stocks are my top picks. The stocks highlighted in rose are those that have broken out today.
The table is divided into three groups: the top seventeen stocks are drawn from the energy, financial, real-estate, and utility sectors—exactly where you'd expect to find the high-dividend payers. The next three are from other sectors that are trending up. The last two are currently in a holding pattern after an initial run up. [Click on the chart to enlarge.]

So, how should you play these?
I know you've heard that stocks that pay a high dividend should be avoided because there's a usually a reason for the high payments. But in many of these cases, I think that the reason is just that they've been way oversold. Some of these stocks are as much as 75% off their highs. However, that doesn't mean you should neglect your due diligence!
I grouped the table according to sector because it's important to diversify your holdings. You don't want your nest eggs to all come from the same basket as doing so increases the risk to your portfolio. Remember, it's not only profits that count, but also the amount of risk that goes into getting that return.
If you don't like my picks, try modifying the screening parameters to reflect your investment taste, but don't waste too much time. I think that now is THE time to begin stocking up on dividend-paying stocks. Go gettem'!
Sunday, May 3, 2009
Weekend Update: Portfolio updates + comments
Dr. Kris has been under the weather for the past quarter-moon which is why I'm not at the birthday party of an acquaintance at a Moroccan restaurant replete with full bar and belly dancers. Feeling a bit better than yesterday at least, Dr. Kris (aka moi) has updated the Channeling Stocks Portfolio. As mentioned in Wednesday's blog, I covered all of my short positions at their closing prices. The chart below reflects that.
As I also said, I don't have time until my talk at the LA Traders Expo on June 4th at the Pasadena Convention Center to contribute more to this portfolio. The only two positions open are the two longs—HNP and OSIP.
But, as I mentioned at the start, this was a strategy that I've never traded before as an entire portfolio and it would be a learning experience for both of us. I've traded a few channeling stocks and index tracking stocks on occasion and made an overall profit on them. At the time, there weren't nearly the amount of fundamental nor technical tools available as today (for better or for worse!), nor was the market so ambiguous. Running this experiment today has been an eye-opener for me
What I've learned from paper-trading Channeling Stocks
Here are some of the more notable things that I've learned from this experiment:
1. In markets that have been trending in one direction for a long time, trying to fade (go against) the market in the majority of picks was not optimum, even though the entry (short) signals were triggered.
Although it might be tough to discern market direction, when the market headed south at the beginning of March and the VIX didn't follow was a signal that something was up, either good or bad. But once the market began rising and the VIX concurrently falling was a time to limit taking on short positions.
2. There's always been a debate between those who think you should put all of your eggs in one basket (e.g. shorting stocks like I did at market down-turns) and balancing your total amount between long and short positions.
3. Unknown factors can be detrimental in any portfolio, such as short-holding Pepsi-America (PAS) which was covered right after the take-over announcement by Pepsi-Co. Unless you have insider info, there's virtually no way you can spot this action. You might expect it if other companies in the sector are cash-flush and hurting for cash flow, e.g., new product.
4. Holding over an earnings release can be detrimental, especially if the release is in sync with current market direction that is opposite to your holding. Take Fiserv (FISV) who reported good earnings after the bell on April 30th. Good thing I chose to cash out of my short positions on April 29th based on other criteria, because my position would have suffered a bit: the stock opened on May 1 (after the good earnings announcement) at $37.58. Had I covered my short at that time, my loss would be -6.3% instead of -4.8%.
Summary
Even the most experienced traders in the business can be unprofitable if they're novices in regards to a new strategy. That's why I'm going to shout the following: PLEASE PAPER-TRADE ANY STRATEGY BEFORE EXECUTING IT! That's how you learn the intracacies that you may never have thought of due to changing market conditions. Your failure does not make the strategy invalid; you just need to learn it.
Many people will tell you that trading the market is easy; if you're new to trading and have good luck, you might agree with them, but after a while your luck can (and probably will) run out. That's when you might consider giving up, but that's exactly the time when you should examine your trades and learn more about why you succeeded and also why you didn't.
Which leads me to the second point: KEEP A JOURNAL!
You're only a failure if you keep repeating your losses.
End of lesson.
Channeling Stocks Portfolio:

[Click to enlarge.]
Wednesday, April 29, 2009
Technical indications of a market recovery
With all the green on my screen and the strong scent of bullishness wafting through the air, I've decided it's only prudent to cut my losses and cover all my short positions in the Channeling Stocks Portfolio. Is this wise or is this rash?
That's the $64,000 question everyone seems to be asking. To answer it, let's look at some technicals.
On the plus side
The VIX (volatility index) has been in a steady down-trend since the middle of January (see chart below). The Dow Transports, widely regarded as being a leading market indicator, has managed to stay above the 300 key resistance level. Financials and banks, given by the XLF and the RKH, have both broken out of their inverse head and shoulders pattern. They haven't exactly zoomed out of the gate, however, and may continue in a sideways pattern for a while until the economy finds its legs. Heck, even some of the homebuilders have broken above their channeling patterns. Take a look at the charts of Meritage (MTH) and KB Homes (KBH) and see for yourself. (The chart of MTH is shown below.)
And contrary to popular belief, the consumer is not completely dead. Consumer Discretionary (XLY) has been following the Retail Holder (RTH), climbing steadily since their March lows (although they do appear to be running out of steam). Because of the threat of the swine flu and recent mergers, the biotech sector has been on fire but that, too, looks like it's poised for a breather. Tech, too, has been rallying. The Broadband Holders (BDH) and the Internet Holders (HHH) are up 25% and 33% respectively since the beginning of March. Really, the only sectors that have been underperforming are the precious metals-- both gold (GLD) and silver (SLV) are down roughly 10% over the last several months.
A couple of negatives
One negative is that the S&P 500 is having a problem closing above 875, a key resistance level. It's traded above that on an intraday basis and I think it's only a matter of days before it closes above it. The real question is: Is this rally for real or is it the response to massive short-covering?
The answer is that I don't know for sure--perhaps it's a bit of both. One non-technical indication that a recovery is in the works is that the number of For Rent signs in my neighborhood seems to be decreasing. Hey, it's not exactly the lipstick indicator, but I think there is something to it.


Click on images to enlarge.
Monday, April 27, 2009


Short-term Swine Flu trades
Many apologies for shirking my blog duties lately. I've been immersed in several business projects which are taking 110% of my time, but that doesn't mean that I'm dropping my beloved blog altogether; rather, my posts will be limited in scope for the next month or so—at least until after the LA Trader's Expo where I'm scheduled to give a workshop on June 4th. More on that as the date approaches.
Today I wanted to provide a list of quick trades that the more risk tolerant may want to consider as a play on the swine flu outbreak. Don't get me wrong, I'm not trying to make light of this subject at all and I grieve for those hundred plus people who have already succumbed to it. Let's hope and pray that this outbreak can be contained and it doesn't turn into a pandemic health crisis. Since we've been given another bowl of lemons, we could at least try to make some lemonade from it, no?
Below is a table of the major players involved in the development and manufacturing of flu-related vaccines, treatments, and tests. The major players are Gilead (GILD) and Roche (trades here as an uninspired ADR) who teamed up to make Tamiflu, and GlaxoSmithKline (GSK—also an ADR) which makes Relenza, an inhaler-based flu treatment. All of these stocks traded on the plus side but they weren't even close to being the biggest winners—their smaller compatriots stole that show.

Topping the small-cap flu-related biotechs today were Novavax (NVAX) and BioCryst (BCRX). Both of them increased at least three-quarters in value and traded at astronomically high volumes. Both stocks gapped up on the open. From there, they meandered steadily downward closing the day near their lows. Novavax took out both its $1.75 and $3.00 resistance levels ending the day at $2.54. It's next major resistance is at $4.00 (for a gain of 57% if it hits it).
BioCryst closed at $3.88. Next point of major resistance is at $5, or almost 30% above today's close. Both of these stocks are short term plays (up to resistance) unless the swine flu crops up in more places. Let's keep our fingers crossed that it doesn't. Here are the weekly charts of the above two companies with resistance levels:


These plays are not for the faint of heart, but if you have a little extra mad money, you could do worse. The good thing is that they're cheap compared with their big-pharma brothers. The bad thing is that I'm getting rather tired of drinking lemonade.
For further info on how these companies are positioned in terms of the swine flu, begin with this article that appeared today in the Associated Press.
Updates to Channeling Stocks Portfolio
Friday's bullish action triggered stop-losses on five short positions in the Channeling Stocks Portfolio: DHR, RBC, ROP, SOHU, and UPL. Both the Channeling Stocks and the MANDA weekly tables will be updated later this evening.
Thursday, April 23, 2009
Quick Update
Just sticking my head in to say that the BLK and TOT short positions were covered in the Channeling Stocks portfolio. TOT almost reached its $45 target several days ago, and today's up movement looked like the $45.02 low put in then was probably the channel low. The nebulous part about playing channeling stocks is that sometimes the target value is never quite reached, and I believe that if the stock starts to move in the opposite direction, it's best to get out of your position.
At least I made a profit on this one. Yay me.
At least I made a profit on this one. Yay me.
Wednesday, April 22, 2009
The debt-to-equity ratio as a fishing lure?
Yesterday I mentioned that people are starting to bottom fish for companies with low debt on the assumption that they'll be the fastest to rebound once the economy starts to recover. But there is contradictory evidence that it's precisely the debt-laden companies that are seeing the biggest rise in stock price. Today I'd like to delve further into this conundrum and see if we can find some clarity.
The fundamental argument
In an article that appeared on MSN Money yesterday, Jim Jubak said that if you want to do some stock shopping, avoid companies that have loaded up on debt such as restaurant chain owners DineEquity (DIN) which sports a hefty debt/equity ratio of 10.22 and Brinker International (EAT) whose debt/equity ratio is a more modest 1.44. (A debt/equity ratio greater than 1 signals that the company is running more on debt than on equity. Stocks with high debt/equity ratios are considered riskier than those companies with little to no debt especially in rising interest rate environments.)
I like Jim's articles. He does his research and knows his stuff, but apparently he forgot to check the charts. Since the market low on March 9th, EAT has doubled in price while DIN has quadrupled--good thing we didn't buy those stocks!
The technical analysis
A recent CNBC guest commentator said that it was precisely these debt-laden companies that have been the best performers in recent months. Not to doubt the gentleman's veracity, I decided to find out for myself. What I did was to screen for the highest percentage gainers in the past month that were over $2 and traded at least 100,000 shares per day on average. (I used the deluxe screener in MSN Money--it's free!) Out of the 100 stocks that came up, seven of them had no debt/equity listing so I discarded them leaving me with a sample space of 93.
Of those 93, 53 companies had debt/equity ratios greater than one, or 57% of the total. That's not much more than average but it is a lot more than I would have expected especially in this credit environment. And of the 26 companies that had gained more than 100% in value, 15 had debt/equity ratios greater than one, or 58%.
Today's percentage gainer list was even more interesting. The top two stocks were Avis/Budget (CAR), up 22%, and Reddy Ice Holdings (FRZ), up 18%. Are they low-debt companies? Hardly. The ratio of debt to equity for Avis is 84.11 which is high even by industry standards (6.18 on average). Even more incredible is that the same ratio for Reddy Ice is an astronomical 450.76, the highest of ALL stocks over $2. I mean, all they do is sell packaged ice, for crying out loud. I don't get it. I can only scratch my head as to why an ice company is topping the list—could this be a play on global warming?
Conclusion
The point to take away here is that it seems as if investors are ignoring conventional wisdom and valuing other aspects of the business besides some numbers on a balance sheet, and to me, that's what really makes sense. But if you want to bait your hook with the debt/equity ratio, I'd use the one that will snag the high-debt fish.
Here's a chart showing how you would have done over the past month had you bought an equal dollar amount of the each of the top 25 debt-laden companies:

Did you see that there were only 5 losers?
Here's the stock move Jim Jubak missed:

Channeling Stocks Update
Today BMI violated its stop and I covered the short position at the closing price. I won't be taking any new positions in this portfolio as right now I don't have the time to search for them. I'm very busy trying to get my website up and constructing my workshop for the LA Traders Expo on June 4th.
Tuesday, April 21, 2009
Are all debt-laden companies bad?
Rumors of the death of the bear market may be greatly exaggerated but that isn't stopping anyone from bottom fishing. From CNBC's Jim Cramer to MSN's Jim Jubak, financial bobble heads are advising their flock to start buying and offering their thoughts on what to buy and what not to buy.
At the top of nearly everyones Do Not Buy List are companies that have loaded up on debt. You'd think that would be a no-brainer but according to a CNBC guest contributor that appeared on the network several days ago (Friday?), the stocks that have been performing the best have been exactly those unloved debt-laden companies while the worst performers have been those touted by analysts and other Wall Street pundits. (I was on the CNBC site and couldn't locate the clip, alas.)
I know this logic sounds completely upside-down. It could be that the cash acquired from taking on debt is allowing companies to function during this time so that when the economy does start to recover, they'll be well-positioned to take advantage of it.
I'd look into it if I had more time today,but I'm off to visit my programmer and work on my website. Maybe tomorrow...
Monday, April 20, 2009
When to count your cluckers
I spoke with an old friend over the weekend who was crowing that he made enough money in the stock market recently to buy a sports car. “That's nice,” I replied, not meaning it of course. I was about to change the subject but instead asked him how he did it. I was especially curious since he had said only a few months ago how he thought the market was completely manipulated and way too volatile and he vowed never to buy a stock again. Since then, he retired from his lucrative physician practice and is finding that he's got way too much time on his hands so he decided to dabble in high beta stocks—quite a reversal from his previous position that the market was too risky!
What is beta?
The point of this article is not to write an academic treatise on beta but since I brought it up I feel it's only right to explain it. A stock's beta measures the amount that a stock moves relative to a benchmark, typically the S&P 500. So, if the S&P moves by -4% like it did today, a stock with a beta of 2.0 will typically move by -8% and a stock with a beta of 0.5 will only move by around -2%. Betas typically fall in the 0.5 to 4.0 range, and there is such a thing as a beta for upward movement and one for downward movements. They're not necessarily the same but most data services only provide one number and I don't know which one that is. (It could be an average of the two.)
To make a short story long, I reminded my friend that high beta stocks are great performers in bull markets but can quickly turn against you in a bear market, to which he replied, “But we are in a bull market!” Doctors in general have a tough time with contradiction and my friend is no exception so I stifled my opinion knowing that it would fall on deaf ears.
Anyway, the point of this piece is not for me to gloat that possibly his high beta stocks didn't fare so well in today's market nosedive and that he might be looking at buying a bicycle instead; rather, I'm mentioning it to emphasize two points. The first is don't gloat about making a killing in the market before cashing in your chickens (to mix metaphors). This happened to two other acquaintances just before the dot com bubble burst. One of them crowed that his dot com call options quadrupled in price and the other said that his retirement account was up by $500,000. When I mentioned to both of them that it might be prudent to take some money off the table, they laughed. They both believed the Dow 50,000 theory that was circulating at the time and hung on to their positions.
You know where this is going. Those call options expired worthless when the company went bust and my other friend confided to me recently that he won't be able to retire when he thought since the value of his IRA had fallen faster than Bernie Madoff's credibility.
The second moral to this tale is that even if you do take some chips off the table, don't gloat about how much you made with the "I'm such a genius" grin. Not only does it make you look like an inconsiderate jerk but things like that usually have a way of coming back to bite you.
That's the part I get to enjoy.
MANDA & Channeling Stocks Update
In the financial world, Monday is called Merger Monday because that's when M&A deals that were finalized over Saturday's golf game are announced. Because of the credit crisis, Merger Monday is now just called Monday but today's mega merger announcements may change that.
Sun Microsystems (JAVA) finally ended its mating dance with IBM and got in bed with Oracle (ORCL) instead. The deal makes sense for both companies as Oracle relies heavily on Sun technology and the companies' CEOs are long-time bffs (best friends forever). The deal relies on the usual shareholder and regulatory approval, and although anti-trust issues can be raised, I do think it will ultimately be approved. The deal is for $9.50 in cash per JAVA share. I picked some up earlier this morning at $9.10 for the MANDA portfolio. This represents a 4.2% return on the trade.
The announcement that PepsiCo (PEP) is intending to buy two of its bottlers, Pepsi Bottling Group (PBG) and PepsiAmericas (PAS) caused both stocks to soar. That's great news if you're long either of them but bad news if you're short like I was on PAS in the Channeling Stocks Portfolio. The stock was covered at today's closing price for a 35% loss on the trade. Ugh ugh ugh. Oh, I'm not buying either PAS or PBG for MANDA because both deals involve stock swaps as well as cash, and I don't like taking a stock swap unless I'm pretty sure of the final price of the company doing the acquiring.
Friday, April 17, 2009
Channeling Stocks Update
No blog today but I did cover my DO short in the Channeling Stocks Portfolio. Below is the table of current and closed positions. In this market, a much better recipe to be playing is the Channel Breakout strategy. Once a stock breaks out of its channel, it has a strong tendency to continue moving in that direction. Here's a list of non-ETF stocks that have recently broke out of their channels: AAPL, AMTD, BBW, CEC, DTV, FLS, KBH, LAZ, MCHP, MHP, NBL, NVDA, ORCL, PANL, PCAR, SEED, SPAR, ZRAN, and ZUMZ (Zumiez) which broke out today.

Click on table to enlarge.

Click on table to enlarge.
Thursday, April 16, 2009
Bullish signs
My charting program was ringing its head off this morning (it has one of those really annoying "ay-ooh-ga" tones) in response to the many bullish alerts that I had set:
1. The VIX closed its gap set on 9/29/08.
2. The Dow Industrials closed above 8000. But more importantly...
3. The Dow Transports finally closed above 300, a major resistance level.
4. All of the major sectors were up today except for precious metals, oil & gas, and utilities.
5. Foreign ETFs had a good day, too, with BRIC countries at the head of the pack.
The only thing that concerns me is the lack of volume in many of these issues, especially the SPY, the S&P 500 tracking stock. Normal volume is in the 368 million share range; today only 86 million shares traded hands, about 23% of normal.
So what's an investor to do? Well, I'd ready a buy list and start dipping my toe into the small-cap waters because that's where my market indicator is generating a buy signal. And, when markets do recover, it's the small stocks that lead generally lead the parade. Although precious metals have been sliding, their poor relatives, the base metals, have been forming a saucer bottom. The chart of DBB, the Powershares Base Metals tracking stock, recently broke out of its saucer base. (The BDG is very similar except that it is an ETN (exchange traded note) and is much more thinly traded.) Note the huge increase in recent volume.

Channeling Stocks Update
Today I exited four short positions at the closing price: DTV, MHP, PANL, and PCAR. No new positions were initiated.
Wednesday, April 15, 2009
What's up with Dendreon?
I have a few moments to spare from my website duties and just wanted to alert you to the recent action in biotech Dendreon (Nasdaq: DNDN). Yesterday the company reported success in extending the survival rate in men with advanced prostate cancer with their immunotherapy drug Provenge. When I first glanced at the stock chart I thought this was another acquisition in the pharma sector since the share price almost tripled on the open to $21.50, up from $7.30 at Monday's close.
The news stunned the seven analysts following the company. None of them had a buy rating on the stock but it's tough to blame them as no cancer vaccine before this has ever had success in late stage testing. After the results were announced, many analysts refused to raise their rating mainly because important details such as how long the drug extended life, if there were any serious side effects, and how statistically significant were the data weren't included and won't be revealed until the company presents its results at a medical conference on April 28th, although in a conference call Dendreon's CEO said that the results were statistically significant in extending patients lives by an average of four months.
If the drug proves to be successful, it is hoped that it can help some of the estimated 29,000 patients who die as a result of the disease each year. The bad news is that the hefty price tag, estimated at $50,000 per treatment, could be beyond the means of many individuals and insurance companies. Also, the treatment is labor intensive and probably wouldn't be advised for the very old or very frail, as one doctor quoted in Forbes noted. Still, even if Provenge is prescribed to a third of the patients (say 10,000), that represents an annual sales figure of a half a billion dollars.
Is that enough to justify the recent price jump? One analyst quoted in a Thomson-Reuters article feels that if there are no flaws in the company's data, there could be an immediate 50 percent upside on April 28th. And if the results are that positive, the company maybe targeted as an acquisition which is what drew me to its chart in the first place. Could other people have the same idea..?

Channeling Stocks Update
For those of you following the Channeling Stocks portfolio, today I added previous long winner SOHU to the short list with a $40 target. I also covered LRY at the closing price of $23.24. If the market continues up, I'll be exiting a lot of positions soon and it won't be pretty.
Tuesday, April 14, 2009
Blog Update
The is Dr. Kris' website developer, Igor, talking. I mean business, so listen up. She's shackled in my dungeon and won't be set free until she's made some significant progress in supplying her soon-to-be-unveiled website. Igor can't do everything himself--grrrr!
Consequently, expect blogging to be on the light side for a little while just until the site is completed. In the meantime, she slipped me a note saying that she did manage to make some additions and subtractions to the Channeling Stocks portfolio behind my back:
ACL, DNB, and RBC were added as shorts. Short holding LAZ violated upper resistance and the position was covered and closed. All trades are made at the closing price.
Monday, April 13, 2009
Channeling Stocks Update
The portfolio is updated to reflect typo corrections and new stop losses based on channel levels.


Portfolio returns: Compound vs Average Returns
In last Tuesday's blog we addressed the issue of what actually goes into calculating portfolio returns. We began by looking at how variations in input parameters can affect the calculation. But that's only one half of the story. Today we'll address the other half: how return values vary depending on the calculation method.
Compound versus average returns
There are two basic methods of calculating the returns in a portfolio--by averaging or compounding-- and understanding the difference between them is crucial to your investment approach and also in comparing fund returns. Contrary to what you might think, you can only spend compound returns, not average returns, but it's the average return that is typically given in fund prospectuses. To understand why this is true, we'll have to look at both methods of portfolio calculation.
Average returns
The average return is nothing more than the arithmetic average of individual returns. This is a simple calculation: average return = sum of all returns/number of returns. For example, if a portfolio returns 10% in each of three consecutive years, the average return is 10% ((10%+10%+10%)/3). The same return can also be achieved by the following portfolio returns: 15%, 25% , and -10%. However, their compounded returns are not the same which we'll see in a minute.
Compound returns
The compound return is a geometric mean that takes into account the cumulative effect of a series of returns. It describes an asset that is reinvested at the same time interval (typically on an annual basis) along with its earnings (or losses). This is what mutual funds do. I won't confuse you with the mathematical formula for compounding, but you can try if for yourself using this handy compounding calculator.
Let's look at a real example of the difference between these two methods of calculation. Suppose you had invested $1 in the Dow way back in 1900. The average annual return of the Dow from 1900 to 2005 was 7.3%. So, by compounding your 7.3% gains annually from 1900 to the end of 2005 you'd expect to have realized $1,752, right? Wrong! If you look at a chart of the Dow, you'll see that it began at 66 in 1900 and ended 2005 at 10717.
Doing the reverse calculation, you'll find that the effective compound interest rate on the gain was really only 4.92% instead of 7.3%. Using the 4.92% as the compounding basis, your 1900 buck would now only be worth $163 by the end of 2005. That's 90% less than using the average Dow value of 7.3%!
What's going on? Why is there such a huge discrepancy in returns? There are two reasons to account for this: dispersion of returns and negative returns.
Dispersion of returns
In finance, dispersion can be thought of as how far the real returns are from the average return. For you statistical wonks, dispersion is related to the standard deviation (the volatility). Thus, the more volatile the portfolio, the greater the dispersion.
The following chart below dramatically illustrates the effect of dispersion on several portfolios with the same $10,000 starting value and the same average return of 10%.

What this table means to you, the investor, is that the compound returns of more volatile portfolios can be significantly lower than the stated average return.
Negative returns
Negative returns is the other factor that can have a major impact on returns. Particularly important to investors is how much their portfolios will have to gain after a downturn. Let's look at the following table:

You can see that the amount that a portfolio has to increase just to get back to break-even magnifies as the amount of loss increases. A portfolio loss of even 30% can take many years to finally recover, and that's not including the time-loss of money—ouch!
Steps you can take to avoid these problems
First of all, it pays to keep an eye on your portfolio. The strategy of buy-and-hold is essentially dead unless you're a teenager and can wait 40-50 years for your portfolio to recover. In bull markets, buying strong stocks in strong sectors (“best of breed” as Cramer would call them) is a popular strategy. In bear markets, going into cash or cash-type of investments (treasuries, high-grade bonds) will spare your portfolio the effect of a large negative return. If you own stocks, set stop losses, and stick to them. If you don't like shorting in bear markets, you can still participate by buying put options or inverse ETFs; however, there's nothing wrong with preserving cash. Unless you have a high net worth or a lot of disposable income, it's best for average investors to avoid placing a large portion of their portfolios into riskier assets such as speculative stocks. This reduces the effect of dispersion, but it can also reduce overall returns, too.
Summary
I hope you've found this article useful. The important thing to remember is that the average return is no indication of how well your money will do in a particular fund. The size of negative returns plus the dispersion of returns are the two factors that will impact your money the most and it's the compound return that tells the real story.
In upcoming articles I'll look at ways the investor can use market timing and portfolio optimization techniques to minimize the effects of negative returns and dispersion.
Channeling Stock Portfolio Update
Long pick SOHU hit its price target and sold for $50.03. An updated chart will be displayed later. There were a couple of typos in the weekend chart which are corrected. Also, the stop loss values are changed to reflect the higher channel value if the stock entry was a short and the lower channel value of the entry was a long as opposed to using the average true range. I feel this gives the trade more time to develop. Time will tell if this is a better stop loss criterion.
Friday, April 10, 2009
Blog Portfolio Weekend Update Tables
There is no new additions or subtractions to the MANDA portfolio.
Here's the updated holdings in the Channeling Stock Portfolio.

Click on table to enlarge.
Here's the updated holdings in the Channeling Stock Portfolio.

Click on table to enlarge.
Thursday, April 9, 2009
Bear market rally or the beginning of a bull?
That's the $64,000 question. Today's market rally, ignited by Wells Fargo announcing much better than expected earnings, did much to calm investors along with positive statements made recently by other major banks. (Um...now why did they need TARP money?) Wall Street is beginning to get a handle on where the situation stands (at least for now) in terms of predicting future earnings. This decrease in uncertainly is reflected in the fall of the VIX, the market volatility index, which gapped down over 4% on today's open and closed at 36.5. A trade below 36 will close last September's gap, adding further fuel to the rally.
Technical bullish signs
Bullish indications are starting to appear, but some of them contain mixed messages. Here are a few of the more notable signals:
1. Rising from historic lows (0.02!), the buy/sell ratio (BSR) finally turned bullish on April Fool's Day. A BSR greater than 1 indicates more buyers than sellers and is a bullish sign; a BSR less than 1 is a bearish sign indicating more sellers than buyers. (Actually, the BSR is a pretty decent timing signal all by itself and an investor could do quite well using it in that way.)
2. The number of new yearly highs is increasing. From just one or two stocks (other than ETFs) hitting the daily highs list a couple of months ago to nearly 30 today—that's a pretty decent jump!
3. Many of the major markets are breaking out or are on the verge of it. Before I toss my cape into the bull ring, however, I'd like to see the Dow Transports close above 300 (it closed a hair under it today). The Transports are considered to be a leading indicator of market direction. If that index can close above 300 and if the VIX drops below 35, then I'll start sliding into long positions.
4. The financials are in an uptrend. Not surprisingly, the banks did especially well today. The Regional Bank Holders, the RKH, and the Financial SPDR, the SKF, both made convincing break-outs (up 22% and 15% respectively) albeit on normal volume. The lack of volume conviction raises some skepticism about the health of this rally, although the relatively light volume could be due to people taking off early for the Easter weekend.
Summary
In summary, optimism seems to be growing but the mixed technical messages suggest that the Street is not quite convinced that this rally has long-term legs. A lot of uncertainty has been removed, to be sure, but that doesn't mean there aren't more skeletons in the closet waiting to be rattled. Furthermore, I'm not sure anyone can accurately predict how continued high unemployment, rising credit card defaults, and increasing real-estate foreclosures will affect the economy.
An update on the VIX: I was wrong
In an earlier blog, I stated that I didn't think the market would reach its bottom until the VIX reached another top. In retrospect, that was probably an erroneous assertion. When the VIX was hitting its previous two tops last autumn, the market was in chaos and nobody knew anything. The credit tsunami hit everyone by surprise and even Wall Street wonks were mystified by credit default swaps and credit default obligations. If nobody understood them, how could anyone accurately predict what the fall-out of the blow-up would be? And what would be the fate of the financial institutions who held them? At that time, confusion and fear reigned supreme.
Today, the situation is different. The mortgage meltdown is beginning to solidify. The government has kept its word and has poured substantial equity into the financial system. The Street is beginning to get a sense of where things stand. All of these factors are allaying investor fear which in turn is causing the VIX to drop and the market to rise.
The March bottom could well be the bottom after all. Most likely stocks were greatly oversold and the recent rally could be nothing more than a return to more normal valuations--not the beginning of another bull market. I'm not sure anyone can tell the difference except for maybe Larry Kudlow.
In short, I'll take my lumps and admit my analysis was wrong. I looked at things purely from a technical standpoint and didn't take into account the sea change in investor perspective. Hey, if I were always 100% accurate I'd be playing yacht tag right now with Larry Ellison.
Channeling Stocks Update
For those of you who are still following the Channeling Stocks Portfolio, today was another bad day for most of it. Three short positions were closed: AMG, AMTD, and NBL. One long position, OSIP, was added. An updated table will be posted this weekend. Tomorrow I'll finish up Tuesday's article on calculating portfolio returns.
Tuesday, April 7, 2009
Portfolio returns: Are you comparing apples to oranges?
Computing the returns on my two portfolios—the Channeling Stocks and MANDA—got me thinking about how fund managers calculate their returns and what those returns reflect. Most folks probably have no idea how portfolio returns are calculated nor what exactly goes into them and I'm not sure that it's even spelled out in fund prospectuses. I thought an article or two investigating this subject might be instructive especially as an aid when it comes to comparing similar types of funds. Readers can also incorporate some of these points into their own portfolio management.
Return calculations can vary greatly according to the input parameters and the administration method which determines how returns are calculated. In this article we'll be looking how returns vary according to input factors. Tomorrow, we'll see how portfolio administration techniques affect yields.
Cash allocations and hedging techniques
There are two major inputs that can affect overall returns:
1. The amount of the portfolio allocated to cash. Fund managers need to have a certain percentage of assets in cash to honor redemptions. Generally speaking, the more the fund is traded, the higher the percentage of the portfolio will be allocated to cash. The amount in cash represents the percentage of the portfolio that is not invested, meaning that in favorable markets, returns will be reduced according to increases in the cash position. On the other hand, in unfavorable markets a larger cash position will help to mitigate losses. The table below illustrates the cash effect.

2. The types of hedging techniques used. Many fund managers earmark a portion of fund's holdings for hedging purposes to guard against currency and interest rate fluctuations. Options and futures are common hedging instruments. Proper hedging techniques can reduce portfolio risk but at the expense of reducing yields. The amount of the reduction depends on the type of hedging instrument and the size of the fund's resources allocated to it.
Fund prospectuses generally give hedging guidelines. Although I've never seen the impact that hedging has had on performance, it doesn't mean that it can't be found somewhere in the fine print.
Tomorrow we'll see how returns are affected by management methods.
Channeling Stock Portfolio Update
Because of the market sell-off in the past two days, I've added more short positions to the portfolio. I just hope they don't bite me in the butt if the market resumes its upward movement which it could do shortly. Although the market moved lower today, so did the VIX which is contrarian sign. Also, the Trin is moving into heady territory, closing the day at 2.29—another bullish sign.
The point of this fund is to learn and have some fun, so here's a list of today's shorts: AMG, LRY, MHP, PANL, PAS, PCAR, and our old friend ROP which I exited a couple of days ago. Yesterday, I also shorted BGG. All prices are closing prices.
The portfolio table will be updated on Friday.
Monday, April 6, 2009
Channeling Stocks Portfolio Update
Below is the current holdings in the Channeling Stocks portfolio. This reflects the past week's additions and subtractions. I did forget to mention that on 4/2 the Ultrashort Financial ETF, the SKF, violated its lower channel forcing a sell. My apologies.
As I mentioned in the MANDA update, please note that the realized return is based on a total portfolio value equal to exactly that of the current holdings (where each holding is of equal dollar value). If a static portfolio value is assumed, the realized return will be a different number (either more or less). There's no one correct way to calculate the theoretical total return. I prefer the former method for a couple of reasons: it's easier to calculate and easier to demonstrate, i.e., the reader can see exactly how each trade performed.
I decided in this portfolio to compare the dynamic realized return to a “static” return. To calculate the static return, I began with a portfolio of $500,000 with each position set at $10,000. ($10 commissions and 4.5% margin interest computed monthly are also assumed.) You can see that the difference between these two returns is quite dramatic: -11.5% for the dynamic portfolio versus only -2.4% for the static one. Obviously, this is because there's a lot of cash in the latter portfolio as opposed to none in the former which cushions the drawdown.

Click on table to enlarge.
MANDA Weekend Update
A little late getting this out, but here it is.
Exar Corporation (Nasdaq: EXAR) successfully completed its acquistion of hi/fn, Inc. (Nasdaq: HIFN) at $4 per share as of midnight April 2nd. This transaction is reflected in the latest MANDA portfolio holdings shown below.
Note that in the MANDA portfolio as well as in the Channeling Stocks portfolio, the realized return is based on a total portfolio value equal to exactly that of the current holdings (where each holding is of equal dollar value). If a static portfolio value is assumed (say a $100,000), the realized return will be a different number (either more or less). There's no one correct way to calculate the theoretical total return. I prefer the former method for a couple of reasons: it's easier to calculate and easier to demonstrate, i.e., the reader can see exactly how each trade performed.

Click on table to enlarge.
Friday, April 3, 2009
The OLED screen revolution

Yesterday I wrote about a revolutionary new technology that is going to make a dinosaur out of Edison's light bulb. That technology is called OLED, short for organic light-emitting diode. Not only will it change the way we light up our lives but also the way we watch TV and interface with our computers. Today I'd like to conclude our discussion of this marvelous new technology by looking at how OLEDs will revolutionize screen technology and the companies that working to make this so.
What's so exciting about OLED screens?
Computer and TV screens based on OLED technology offer many advantages over today's flat-panel LCD (liquid crystal display) and plasma technologies, including the following:
1. Lower power consumption, making them a better choice in portable devices where energy efficiency is at a premium. Also, many countries and a few states including California either have or are considering banning large plasma screen TVs because they're such power hogs.
2. Faster refresh rate and higher picture contrast.
3. Greater brightness and a wider viewing angle.
4. Greater durability with the ability to operate over a broader temperature range.
5. Thin, light weight, flexible and even transparent which will make for exciting new displays. (The Sony flex-screen prototype is shown in the photo at the top.)
It's the last feature that's generating the most buzz. Imagine a widescreen TV that you can roll up, tuck under your arm, and unfurl anywhere—how cool is that? This is why there's so many entities interested in developing this technology as quickly as possible.
Of course, there are obstacles that must be resolved first. As I mentioned yesterday OLED technology is already being used in small-screen devices such as cell phones, digital cameras, and PDAs. Problems arise in translating the technology to larger screens. One of the main challenges is display lifetime especially with the color blue, but with the number of players all racing to develop this technology, industry experts feel that these problems will be conquered within a few of years.
The major OLED players
Governments, universities, and industry have come together around the world to fund joint research ventures into this promising and potentially vastly lucrative technology. In yesterday's article, I mentioned GE being at the forefront of developing OLED-based lighting. Also in that field is Energy Conversion (Nasdaq: ENER) and Universal Display (Nasdaq: PANL). (I forgot to mention Philips. See below for more info.)*
The major industry players in OLED screen development are the usual suspects: Sony (NYSE: SNE), Panasonic (NYSE: PC), LG Display (NYSE: LPL), Samsung, and Toshiba (these last two trade as bulletin board stocks in the US). Sony was the first company to bring a larger screen TV to market, the 11” XEL-1. The super-thin TV (shown above) was introduced late in 2007 at a price of $2500. A 27” model is in the works with plans to be introduced sometime in 2009, according to Sony CEO Howard Stringer.
Samsung has sent out mixed messages regarding its release of wide screen OLED TVs. First the company said February that they are committed to OLED technology giving a 2009 release date for OLED TVs and laptops and a 2010 time frame for the release of flexible OLEDs. Yet, a month later the VP in charge of Flat Panel Development said that the public shouldn't expect any OLED TVs from them anytime soon. Nobody is sure what happened—whether the company is getting its wires crossed or that it's reconsidering its commitment to OLED TVs. There's a good case for the latter scenario as advances in LCD technology has significantly lowered power consumption and they're much cheaper to make.
Toshiba has also put development of large-screen OLED TVs on hold citing high manufacturing costs. On the flip side, LG unveiled a 15” OLED TV at the 2009 Consumer Electronics Show in January. They're hoping to get it to market sometime this summer. No pricing structure has been set as yet.
A brief glance at the charts
The non-bulletin board stocks--Sony, Panasonic, and LG--are all trading off multi-year lows. LG's chart is the most compelling. It's trading near $12, double the price of its November low. Volume has been heavier than normal and yesterday it broke out of its base.
Summary
There seems to be an exciting and profitable future in store for OLED-base technologies, especially in lighting. Right now there are a lot of technological and cost impediments to widespread production of OLED computers and TVs, but I do believe that day will come. And I hope it's soon because I sure hate lugging my heavy laptop everywhere!
*One company I neglected to mention yesterday (because I just discovered it today) is Philips Electronics (NYSE: PHG) which is also racing to develop its own line of OLED lighting panels under the Lumiblade name. It plans to offer architects and lighting designers OLED starter kits to introduce them to this technology. Sounds like an excellent marketing plan. Philips stock has been stuck in the $15 - $20 range, trading well off its recent high of $45. A convincing break above $20 would be a good entry point.
Thursday, April 2, 2009
The coming OLED revolution

How about going into a restaurant and ordering right off your place mat? Or covering your walls with a thin flexible plastic film that can not only light up your room but turn it into a giant video screen? Or rolling up your TV or computer screen into a scroll and popping it into your carry-on luggage? Does all this sound like science fiction? Well, it's not, due to recent advances in lighting technology—more specifically, organic light-emitting diode (OLED) technology.
OLEDs aren't new. In fact, they're already being used in small display items such as digital cameras, cell phones, and car stereos. But there are problems in translating them to a larger screen format. Many companies, in collaboration with major universities (Princeton and USC in particular), have been working to solve these problems and it looks like they're getting close.
What is an OLED?
Many of you may not have heard of this technology. Briefly, an OLED is made by placing a series of organic thin films between two conductors. When an electrical current is applied, light is emitted. Don't think that the organic part of the device is something culled from your compost heap. What “organic” refers to here is that the light-emitting substance is carbon-based.
The really great feature about OLEDs is that they emit light and because of this they do not need to be backlit as do LCDs, making them highly energy efficient and very thin. This makes OLEDs perfect for things such as TV and computer screens as well as all sorts of exciting non-traditional, power-efficient lighting products.
I wanted to discuss both screen and lighting technologies in one article but it's turning out to be a bigger project than I thought (it usually is). So, today I'm going to begin with the lighting side. You may not think a light bulb is as sexy as a roll-up computer screen, but I believe that OLEDs have the potential to revolutionize both the home and commercial lighting industries and could ultimately represent a much larger piece of the profit pie.
What's so great about OLED lighting?
First of all, an OLED “light bulb” really isn't a light bulb in the traditional sense at all. It's actually a thin film of material that emits bright, white light. OLEDs can be made flexible or even transparent, opening up an entire new spectrum in lighting design. In addition to their high energy efficiency, OLEDs do not contain any environmentally unfriendly metals like mercury. The world's first OLED table lamp designed by Ingo Maurer and manufactured by OSRAM is shown at the top. (If you want one of these it'll set you back $25,000 euros—and that's if you can even get one since only 25 were made. Let's hope that when Ikea gets its hands on the technology, the manufacturing price will have come down significantly.)
OLED lighting research
Leading the way in OLED research is industry behemoth, General Electric (NYSE: GE). (They're still bringing good things to light!) As part of its ecoimagination initiative, GE has made substantial investments into OLED research which has resulted in dramatic increases in OLED lighting efficiency and decreases in power consumption and production costs. Via a collaboration with its research unit, GE Global, solar laminate producer Energy Conversion Devices (Nasdaq: ENER), and the US Commerce Department, the group successfully demonstrated the world's first “roll-to-roll” OLED lighting device in 2008, a key step in making OLEDs at substantially lower costs.
For this collaboration, GE provided the organic electronics technology and was responsible for developing the roll-to-roll process. Energy Conversion (ECD) provided its unique roll-to-roll manufacturing machine which is still being used by GE in further research.
This roll-to-roll process is similar to the way newspapers (remember those?) are printed and has the potential to eliminate the manufacturing hurdles that prevent widespread adoption of OLED-based technologies. Currently, OLED products are high cost because they are made using conventional batch processes, and anyone who can streamline the manufacturing process will be ahead of the game. Although there are still a few kinks that need to be worked out, GE's goal is to introduce OLED lighting products by 2010.
OLED lighting Companies
Although ECD provided the means for the GE experiment, its main focus is on thin-film solar energy technologies. But that doesn't mean it can't become a player in the OLED lighting field. Current prospects, however, look far from rosy as it lowered previous guidance citing financing difficulties caused by the recession.
GE has its hands in practically everything and in no way can this be company be considered a pure play on the OLED market. So, what other companies besides ECD and GE are working in this area? Plenty. Research in this area is global: The EU is backing several OLED projects while in Japan several big technology players have joined forces to create Lumiotec to focus specifically on OLED light bulbs.
Publicly traded companies in this country include Universal Display Corp. (Nasdaq: PANL). This company doesn't do any OLED manufacturing preferring to develop and license its technologies to other manufacturers. One of its major advantages is that its light-emitting substance is phosphorescent in nature as opposed to fluorescent which is used by its competitors at Eastman Kodak and Cambridge Display (acquired by Sumitomo Chemical in 2007). Phosphorescent OLEDs require significantly less power.
Chartwise, ECD seems to be putting in a bottom, closing today near $15. It's 80% off of its September high of $80. This stock could take a while to get moving again. Universal Display is faring much better. It's on the verge of breaking out of a double bottom formation and is trading near $10, or 100% above its recent $5 low. (See chart below.) A push higher on increased volume might be a good time to jump in. Both companies will be reporting earnings sometime in early May.
There's a lot of cross-over between the lighting and screen business and many of these companies are involved in both. I'll cover the OLED screen makers in an upcoming blog.

Note: Dr. Kris holds no positions in any of the stocks mentioned in the above article.
Blog Portfolios Update
Ai-yi-yi! Today's bullish action almost clobbered the Channeling Stocks Portfolio. By mid-day, it looked like I would have to dump half of my holdings but thanks to a late day slump, I was spared much of the pain. I ended the day having to dump Flowserve (FLS) and finally Roper (ROP). The good news is that we've just learned two things: The value of paper trading a new strategy and the deleterious effect of trading against a strongly trending market.
On the MANDA Portfolio front, the news was much cheerier as Dow Chemical (DOW) finally made good on its acquistion of Rohm-Haas (ROH). Because of the merger delay, Rohm shareholders will wind up receiving almost a dollar more per share than the original $78. The stock has been held in MANDA since last July and has collected $1.23 in dividends since then, yielding an 8.3% return on the trade. Yay!
Wednesday, April 1, 2009
Channeling Stocks & MANDA Updates
I was off-site yesterday meeting with my web developer and did not get a chance to post the updates to the new Channeling Stocks Portfolio and to the MANDA Portfolio which is an M&A fund.
Channeling Stocks additions and subtractions
It's either a bad twist of fate of a cruel April Fool's joke, but the market has been going against the grain of this portfolio where the holdings are all on the short side. (Although I'm long the SKF, it is a bear ETF.) Stop losses were triggered today on Goldman Sachs (GS) and Roper Industries (ROP), but I only got rid of Goldman. I'm keeping Roper because I believe the stop loss was set too low. I'm raising it to $44 near the top of its channel. This will allow the stock a bit more "wiggle" room. Today's gain came on very low volume which leads me to believe that there's not a lot of investor confidence in the up direction. We'll see. As I said, this is going to be a learning experience for both of us and I'm doing this so you can see the thought processes that go into my choices. This isn't as easy as it looks!
Long entry points were established on two stock candidates: Huaneng Power (HNP) and Sohu (SOHU), both Chinese companies. Huaneng was picked up yesterday at its closing price of $26.85. The target price is $30 and $25 is the stop loss.
Sohu was acquired today at its closing price of $43.63. Its price target is $50 with a $40 stop loss.
MANDA update
No new additions have been made to the M&A portfolio but one merger was completed this week. Private equity investment group JLL Partners completed there acquisition of Pharmanet Development (PDGI) on Monday. Shareholders of PDGI received $5 in cash per share. In the MANDA portfolio, this represents an 8.7% gain on the transaction.
The updated portfolios will be posted on Friday (or over the weekend).
Now back to researching today's blog which I'm hoping will be out early this evening.
Tuesday, March 31, 2009
Channeling Stocks Portfolio
Here's the new Channeling Stocks portfolio. There are nineteen short stocks, and one long (the ultrashort financial ETF). Stop loss prices are determined by adding or subtracting the average true range to the cost basis, depending upon whether the position is a short or a long one.
Equal dollar amounts are assumed. Commissions are $10 per trade and the margin interest rate is 4.5%. There's no account interest.
The market is up as of Tuesday morning. I hope I don't get stopped out of these!
[Click on table to enlarge.]

Equal dollar amounts are assumed. Commissions are $10 per trade and the margin interest rate is 4.5%. There's no account interest.
The market is up as of Tuesday morning. I hope I don't get stopped out of these!
[Click on table to enlarge.]

Monday, March 30, 2009
A New Channeling Stock Portfolio
Last week I promised to introduce a couple of new portfolios, and today I'll be honoring that by introducing a new portfolio based on Recipe #3: Chocolate Channeling Bars. Before we start, I want you to know that I do test out each recipe either by back-testing (if appropriate), paper-trading, and/or real-time trading. I've played channeling stocks before and have done well with them, but I've never quantified my results. So, I thought I'd put my (paper) money where my mouth is and see how well I could do in real-time.
The strategy
To that end, I've designed the Channeling Stocks Portfolio according to Recipe #3. Basically, the strategy is a simple one: Identify stocks that “channel” between a lower support level and an upper resistance level and then enter a long position when the stock begins to bounce off of its low and sell when it reaches its high (or close to it). A short position can also be taken when the stock begins to roll off its high and covered when it nears support.
The set-up
The portfolio will be constructed according to the following guidelines:
1. Equal dollar amounts of stock will be used. This prevents overweighting in higher priced issues.
2.End-of-day prices will be used for simplicity, although better results may be obtained by using intra-day prices.
3.Stop losses will be set at 1 N (where N = average true range) below support levels and 1 N above resistance levels. This is an arbitrary figure but in general this approach limits losses to between 7% and 10%.
4.Short positions in stocks above $5 will be taken when indicated. This assumes a margin account and I'll be using 4.5% as the margin interest rate which is appropriate for accounts between $250,000 and $500,000 in size. An initial portfolio of $500,000 will be assumed. Note that account interest rates are effectively zero (about 0.05%) and are not worth bothering with.
5.A flat commission fee of $10 per trade will assumed no matter how many shares are traded. For computational purposes, each trade will be sized at $10,000 each. There will be no portfolio compounding.
6. Options strategies will not be used for now.
The portfolio
One good thing about this current market is that a lot of stocks have been stuck in trading channels, giving me no shortage of viable candidates. In fact, I've found 24 that fit the bill and later this evening I'll be collecting them into a table along with their entry, target, and stop loss prices. Each day at the end of my blog, I'll update you as to new portfolio additions or subtractions. An updated table including the transactions for the week will be posted each weekend. This way you can follow along in the fun and hopefully this will be an instructive lesson for both of us.
Friday, March 27, 2009
I'm still here!
Just a note to my readers to say that I've been working hard on de-kinking my website as well as putting together two new portfolios. I'll be introducing the first one either later today or over the weekend.
I'm also doing research on an exciting new technology which I think is going to have significant impact our entire lives--from the way we light our homes to how we watch TV to how we read books and newspapers. I'm working on identifying the companies at the forefront of this technology and will report on it shortly.
Great stuff so please stay tuned!
Wednesday, March 25, 2009
The impact of blow-out earnings in an unfriendly market
Dr. Kris isn't too big to admit that sometimes she can just be plum...uh...incorrect. Yeah, that's the word. One thing that I wasn't quite correct on was my analysis of post-earnings plays as given in Recipe #12: Post-Earnings Pot Roast. I claimed that the recipe of buying stocks on companies that blew-out analyst earnings estimates to the upside could be purchased and held right up until the next earnings release (barring any intermediate negative news on the company), and vice versa with negative blow-outs. (In this latter case, you would take a short position until otherwise indicated.)
This is a valid recipe but I failed to mention one major ingredient—market direction. If the market is trending upwards, then taking long positions on companies that beat analyst estimates and holding onto them up until their next earnings release generally provides positive returns. What I failed to look at was what happens when the market is trending in the opposite direction--does that have any impact on the strategy?
Yes, it does. Take a look at the price movement of Myriad Genetics (MYGN) shown below. You can see two humps (for lack of a better word) appearing in its daily chart since November. I knew when I saw them that they were most likely the result of blow-out earnings and I was right. On 2/3/09, the company reported 43 cents/share as opposed to analyst estimates of 32 cents, and on 11/4/08 they reported 30 cents/share as opposed to an estimated 14 cents. But if you had played the earnings after each announcement expecting a big pay-day, you might have been disappointed.
The chart shows that investor euphoria only lasted about a week to a week and a half before the stock retraced back to its trend line. Don't get me wrong--had you held the stock since last November, you'd be sitting pretty, but that has more to do with the company's products and fundamentals rather than momentum.


Compare this chart with that of the S&P 500 and you can see a rough correlation between the stock's price and the trend of the overall market. Yes, Myriad has moved up while the market has moved down, but you can see how relative movements in the broader market influenced the movement in the price of Myriad. I think that if the broader market had been trending up instead of down, Myriad would be trading at a much higher price than it is now and the trend line in the chart might then be situated at the high points of the humps instead of well below them.
Conclusion and apology
To those of you who might have been following my post-earnings strategy, I truly apologize for the lack of foresight in including market direction as a fundamental ingredient. Cooking without it can make for some unpalatable long-term returns. If you do wish to play this strategy against the market grain, I strongly recommend taking a quick profit as your gains could evaporate faster than an AIG executive's bonus.
Note: I'll be modifying Recipe #12 to reflect this discussion.
Tuesday, March 24, 2009
MANDA Update + New Portfolios
I'm busy working on two new portfolios that will be introduced shortly which is why today's blog is rather thread-bare. But I do want to alert all of you who are following my M&A portfolio (MANDA) that portfolio constituent, Aladdin Knowledge Systems (ALDN) today completed its merger with private equity group Vector Capital. Aladdin shareholders will receive $11.50 in cash per share. This represents a 5.3% return on the trade. Overall, the MANDA portfolio is up 2.6% since 6/26/08 inception. Compare that with -37% on the S&P 500. Woo-hoo!
Here's the list of all open and closed MANDA trades since portfolio inception.
[Click on table to enlarge.]

Here's the list of all open and closed MANDA trades since portfolio inception.
[Click on table to enlarge.]

Monday, March 23, 2009
Trading with the Trin
Can extreme values of the Trin predict a market reversal?
In last Wednesday's blog ("Beware the Bull Trap") I mentioned that extreme values in the Trin, aka the Arms Index, typically precedes a market reversal. High values signal a short-term bottom and low values a short-term top. According to one article on trading with the Trin, the author states that extreme values in the Trin signal a market reversal roughly 90% of the time. I know from extensive experience day-trading the index futures that extreme values in the Trin generally did precede a market reversal, but I wanted to see for myself what that correlation is.
To that end, I analyzed the charts of the Trin and the S&P 500 index for the past year. The two charts below show the results of my analysis. (It also took me all day to do this which is the reason my blog is out so late.)
There is a correlation, but it's not 90%
The top table shows the correlation between a low closing Trin (<0.5) and the next day's opening and closing prices on the SPX. The market did, indeed, fall as predicted more times than not, but with a high standard deviation. If you had shorted the SPX on the previous day's close, the table suggests you'd do better not only return-wise but also percentage-wise by holding your position until the next trading day's close. Had you made every trade, you would have won 62% of the time averaging three and a half points per trade. That's not bad especially if you're trading futures. (Note that these figures do not include commissions or slippage.)
Looking at the other extreme (Trin >2.5), the bottom table shows a similar 62% success ratio for both the opening and closing trades. Had you bought the SPX on the close, you would have profited quite handsomely--over eight and a half points on average!--by holding your position until the next day's close. In fact, selling on the next day's open is a break-even proposition at best in this scenario.
Summary
Although there are only 16 data points in one case and 29 in the other, I do believe that's enough data to infer that extreme Trin values can be used effectively to trade market reversals. High Trin values especially lead to greater profits, and I think that futures traders stand the most to benefit from this strategy. Of course, judicious application of appropriate risk management techniques can reduce loss in those cases when the market doesn't move as expected as no S&P futures trader wants to get stuck with a 59 point loss!
[Click on charts to enlarge.]
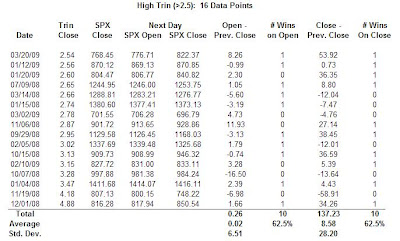


Thursday, March 19, 2009
Market Update
A quick blog today as I'm in the midst of doing some new research as well as meeting with my website programmer. BTW, the new site is looking absolutely fabulous and will hopefully be up and running within the month.
Follow-up from yesterday
Yesterday I noted that the excessively high positive levels in the VWAPs combined with the extremely low value in the Trin (Arms Index) pointed to a lower opening today. That did not happen as most of the major indices opened up, but my forecase wasn't completely off-base as most of them drifted lower as the day wore. The Trin roughly mirrored the opposite movement hitting an intra-day high of over 1.60 (compare that with yesterday's values between 0.3 and 0.5). There's still more than a half hour to the closing bell. Barring an eleventh hour rally (which can happen), all of the indices look poised to close down on the day (around 1% for the S&P and the Dow 30).
Today's action
The oil, gas, solar energy, coal, and metals (gold, silver, aluminum) sectors rallied nicely today with many issues gapping up strongly on the open and rallying off of multi-year lows. The drillers especially look good. Here's some that broke out of their bases today: Berry (BRY), Dril-Quip (DRQ), Diamond Offshore (DO), Murphy Oil (MUR), and Ultra Petroleum (UPL). In the gold sector Randgold (GOLD) is nearing its all-time high set almost a year ago. The stock has already rallied 67% from its October low and its chart is showing no signs of slowing down.
The financial outlook
Bank and brokerage stocks have been rallying along with the overall market and a good question to ask is if this rally is genuine. The XLF, the financial ETF, is trading around $8.80 and the regional banking ETF, the RKH, is about $53.50. They're both getting close to overhead resistance which they need to break through in order for this rally to have any legs.
A more visual way of evaluating the status of financials is to look at the ultrashort financial ETF, the SKF.

The chart shows strong support at $100, a level it must break before the financials have a even a hope of rallying.
That's it for today.
Wednesday, March 18, 2009
Beware of the bull trap!
Today's market action seemed to echo the words of Robert Browning: “God's in his heaven, all's right with the world.” Buoyed by AIG CEO Edward Liddy's promise that some of the $165 million in employee bonuses would be returned to taxpayers (and the ones who won't be returning theirs will at least have to give back a portion of it in income tax) along with the Fed's promise to buy more mortgage backed securities and long-term Treasuries, the market was bathing in a sea of green. Pretty much every sector was up, including emerging markets and gold. There was a noticeable absence of decliners, although the dollar took a tumble. The VIX (volatility index) also closed down but still slightly above support at 40.
So, is now the time to take the money you've been hiding under the mattress and go long? Maybe, but I don't think so. Today's action was almost too good to be true and I'm betting that tomorrow's action won't be quite so rosy.
Here's why.
The Trin is very bearish
The Trin is an acronym for TRading INdex. It's a technical indicator developed by Richard Arms. Because of this, it's also referred to as the Arms Index. The Trin is easy to understand. It's given by the following equation: Trin = [# of advancing issues/# of declining issues]/[volume of advancing issues/volume of declining issues].
A Trin less than 1 is considered to be bullish because the market is advancing on expanding volume. A Trin greater than 1 is bearish for the opposite reason. The Trin typically hangs out in the 0.8 - 1.2 region, and when it moves much above or below that area, that's when traders take notice. Extreme levels on the Trin signal that a reversal in market direction is imminent. (A Trin below 0.5 signals a short-term top; a trin above 2.0 signals a short-term bottom.)
For the past week, the market has risen as the Trin has fallen. Yesterday, it hovered in the 0.4 - 0.6 range and today it fell even lower, closing just above 0.30. This is a strong signal that tomorrow's open will be lower.
The VWAPs are at extreme values
The Volume Weighted Average Price is a trading benchmark commonly used by institutions. It's calculated by taking the weighted average of the prices of each trade. What it really measures is how much interest (or lack of it) there is in a stock. VWAPs on the order of 0-80 are mildly bullish; 80-150 is bullish; and 150+ is very bullish. Stocks trading below their VWAPs are those that traders are trying to unload. VWAPs from 0 - -80 is mildly bearish; from -80 - -150 is bearish; and below -150 is very bearish.
Today we saw positive VWAPs in the +200 to +300 range and virtually none on the negative side. This is another indication that stocks may be over-bought in the short term.
Summary
The moral of the story is that it might be a good idea to sit on your hands for the next few trading sessions. My stance won't turn bullish until the VIX moves and stays below 40, although I'd really like to see it break 35. Remember that we're not even half way through this credit crisis and there's still a lot more pain to come in residential and commercial mortgage-backed securities and in the consumer credit space.
All is not right with the world just yet.
Subscribe to:
Posts (Atom)

