Monday, March 31, 2008

The Earnings Trap

I've mentioned before that holding a stock over its earnings can be very risky. If you're a long term investor, then perhaps you don't have to pay attention to earnings dates, but by not doing so can be detrimental to your portfolio, at least in the short term. Witness the chart of Ameron (AMN).


Ameron reported earnings on Feb. 26th. You would think by the 25% one day price drop that earnings were ugly. Had they badly missed estimates? Were there accounting problems? Had the CEO and CFO absconded with corporate profits? The answer is: none of the above. In fact the company reported a healthy 24% gain in sales over last year's quarter and a 14% jump in earnings to $1.07. So what was the problem? The problem is a combination of two things. Although sales beat Wall Street estimates, earnings fell short of the $1.30 estimate. Strike number one. This fact was exacerbated by the recent run-up in share price which reflected investors anticipation of good earnings news. However, their hopes were quickly deflated by the actual numbers thus contributing to the stocks quick and dramatic decline.

If you want another stock that is pooping out on good earnings news, look at the action in Cal-Maine Foods (CALM).


They reported before the market opened this morning. For the fiscal third quarter, they reported higher sales compared with a year ago and their earnings per share tripled, from $0.74 to $2.41. Wow! (As a note, they did not offer any negative guidance and in fact said that they're going to start paying dividends.) In pre-market hours, the stock was trading up. Now, at the close, the stock not only gave up its pre-market gains, but is down over 17% from its intra-day high. This is the stock's biggest one-day loss in a long time.

These two examples aren't unusual in the least. As I've mentioned previously, the stocks that stand the most to lose from a less than stellar earnings report are the ones who have the most expectation built into them. They're the ones who have become market darlings, so if you own some of those, you may want to pay particular attention to their earnings release dates and perhaps lighten up on your holdings before then. (Another way to minimize your risk is to write covered calls or buy protective puts.)

I hope this brief tutorial has been instructive. I want you to be armed with the knowledge that it's in your power to protect your portfolio against potentially large losses due to earnings releases.

Friday, March 28, 2008

Catch a Falling Star

In regards to yesterday's recipe on Falling Star Stew, I've come up with some candidates that fit the criteria outlined in the recipe. To recap, the object is to find companies that have risen dramatically in a short period of time, have formed at least three peaks (four is mo' bettah), and with the final peak height significantly above its 200dma (50-100+%).

I found three candidates that look like they're starting to poop out and a slice through their 50dma's could be imminent. They're listed with their current price along with their peak percent above their 200dma.

Symbol-----Company------------Price-------%(Peak-200dma)
BVN--Comp. Minas Buena.--------$71-------------55%
MTL-----Mechel Oao-------------$120------------87%
MOS--------Mosaic---------------$105------------77%

Actually, BVN and MOS both recently sliced through their 50dmas on heavy volume and both are on a technical rebound. If they break back down below their 50dmas, that would be the time to put on one of the short strategies mentioned in the recipe. (Either short the stock or buy puts.)

The following is a list of candidates that have risen dramatically and are trading well above their 200dmas but have not begun to break down as yet. Keep these on a watch list. Note that all of the stocks below are optionable.

Symbol-----Company------------Price-------%(Peak-200dma)
LNN---------Lindsay-------------$102-------------52%
POT---------Potash--------------$160-------------51%
BZP----------BZP-----------------$22-------------91%
CF----------CF Ind---------------$108-------------56%
ANR------Alpha Nat.--------------$43-------------59%
CALM----Cal-Maine--------------$37--------------67%
SID-------Comp. Sid.--------------$36-------------71%
WLT-----Walter Ind.--------------$63-------------62%
OFG------Oriental Fin'l------------$20-------------53%
JRCC---James River Coal----------$17-------------82%

That's about it for today. I'll keep these on a watch-list to see how they perform over the next few months. Maybe we can catch a few falling stars and put some profits in our pockets. That'll brighten up any rainy day!

Wednesday, March 26, 2008

African Safari, Part II--A Brief Overview of Frontier Markets

Yesterday I introduced the topic of investing in Africa and included a summary of a recent stock fact-finding trip to several small countries in western Africa. Now that you're acquainted with the area, I'd like to focus today on the risks and rewards of investing in this region as well as tips on how to go about it.

What is a “Frontier” Market and why invest in them?

Most of the sub-Saharan African markets are termed “frontier” rather than “emerging.” To understand the difference, one has to first understand the concept of an emerging market. An emerging market, or EME, is a transitional economy, meaning they are in the process of moving from a closed to an open market economy while building accountability within the system. Examples include Russia and Eastern bloc countries as well as China and India. Emerging economies will implement economic reforms that lead to more efficiency and transparency in their capital markets. They usually receive aid from large donor countries and/or the World Bank or IMF (international money fund).

In contrast, a frontier market is even less developed. These countries have investable securities but are usually fraught with political and infrastructure problems. Most of the sub-Saharan countries fall into this category. Considering these risks, why would any sane investor want to put money in them? There are several compelling reasons why, among them being that there are frontier stocks that show stable growth, relatively low P/Es, low volatility, and offer stellar returns as well as portfolio diversification. The catch is that you have to be selective and if you can't do that yourself, select a money manager who can. (More on that later). The reason that frontier markets are attracting investors is due in part to the rising price of commodities, improving infrastructure, increased emphasis on education (in some countries), and at least an attempt at political reform--all of which are contributing to economic growth and higher corporate profits. To be sure, political stability is yet a dream for some countries, but with the growth in education and the rise of the middle class, reforms are inevitable.

The opportunities for investing in frontier markets haven't been lost on global investors. According to EPFR Global, a company that tracks fund flows and allocations globally, net inflows into African regional equity funds hit $650M in 2007, up about $100M from the year before. Since these markets are comparatively small, this influx of new capital has had an inflationary effect. According to Ryan Shen-Hoover (whom I mentioned yesterday), the P/E ratios of Zambia, Malawi, and Kenya have risen three to four fold in the past five years. Currently, they stand in the 15-20 range which still is quite reasonable. (In contrast, the P/E of the Vietnamese market is at 94; Bulgaria at 54; Slovenia at 42; and Romania at 36.)

Also, the US Government is getting into the act. Just last November, Treasury Secretary Paulson visited Africa and announced that rather than give aid directly, the US will supply up to $250M to jump-start three new African investment funds intended to boost development of its capital markets so that African businesses can more easily raise capital. The financing will be provided by the U.S.'s Overseas Private Investment Corp. (OPIC). Millenium Global Investments, a private investment firm, was selected to manage the portfolios. (I couldn't find out if these funds would be open to private investors, but if you're interested, contact either OPIC or Millenium.)

How can I invest in these frontier markets?

Unfortunately, there's no easy way to invest in these markets. You can invest in them directly but that can be costly and paper-work intensive as Ryan Shen-Hoover outlines in his recent newsletter (http://www.investinginafrica.net/). The few funds and ETFs that are available to the small investor and that cover emerging markets include little to no frontier investments. (Some of these funds include the T. Rowe Price Africa & Middle East Fund (TRAMX), and the GAF which is the Africa and Middle East SPDR.) True frontier funds are found in the hedge fund world and are only open to high net-worth individuals. (As I mentioned yesterday, Ryan Shen-Hoover is opening his own African frontier fund and he's allocated a limited number of spaces for the smaller investor.)

So what's an interested investor to do? At the moment, there isn't much one can do, alas! But there is a bright spot on the horizon--the ETN, or exchange-traded note. The ETN is a bond whose value is pegged to an index such as a stock, commodity, or currency index. Barclay's is a major player in ETNs and so is Goldman Sachs. (Bear Stearns is too but who knows what lies in store for them?) Hope is that one of these major investment firms will create an ETN that is pegged to the African frontier market. Until then, it's a good idea to at least be acquainted with the field so that when the appropriate investment vehicles arrive, you'll be able to know if they make sense to you and pounce on them before everyone else does.

Tomorrow we'll return to our regularly scheduled programming, but it's nice to take an arm-chair vacation once in a while.

Tuesday, March 25, 2008

African Safari--Bagging Big Game in Small Countries

When I was a young girl, I was enthralled by a book called “African Hunter.” The book was an autobiography of a white African hunter and it opened with him tracking down a rogue elephant that destroyed a small African village. As I recall, he felled the marauder with an elephant gun while the beast was charging him. Wow! Now here was a real Indiana Jones! I whisked through the book like that marauding elephant and was saddened when the last page was turned. Each chapter detailed an exciting adventure where the hunter risked life and limb in dangerous pursuit of big, exotic game. Not remembering who wrote it, I did an Amazon search and found that it fits the description of a book written by Baron Bror Von Blixen-Finecke in 1938. The Baron was a Swedish dude who married his Danish cousin, Karen. You might know her from her pen name of Isak Dinesen. Anyway, the baron moved to Kenya and ran a firm of safari guides, often being the guide himself. So cool was he that adventuress and author Beryl Markham wrote, “Bror was the toughest, most durable white hunter ever to snicker at the fanfare of safari or to shoot a charging buffalo between the eyes while debating whether his sundown drink would be gin or whiskey.” You gotta love the guy.

I hadn't thought of this book until recently when my friend Alice returned from a stock scouting trip to Ghana and the Cote d'Ivoire. The trip was organized by Securites Africa, an African trading and investment firm, and led by Larry Speidell of Frontier Markets Asset Management. Also on that trip was Ryan Shen-Hoover who has been investing in Africa for years and who puts out an excellent newsletter. (A free copy of his latest newsletter can be yours by signing up on his website: www.investinginafrica.net. )

Why am I even mentioning the notion of investing in these small, highly volatile African countries when my focus is on stock strategies? For two reasons. One is that because of the baron's exciting book, I'm especially curious to see if this continent is still as wild and woolly as I had pictured it; that is, do elephants still terrorize villages? And the other is more mundane: With all of this talk on emerging markets, is there gold to be mined in the African stock market?

This is a big subject and one that deserves more than a cursory glance. So I've decided to break it up over the next day or two and focus on different aspects of the African markets. Today I thought we'd address my curiousity: What is the “new” Africa all about? If you'll take a look at Shen-Hoover's excellently written and beautifully photographed trip account, you'll see that Africa isn't the grass-thatched huts inhabited by people with bones through their noses that I had imagined. Rather, it's become very modernized (at least the countries that he visited) with large thoroughfares and gleaming skyscrapers. That isn't to say that it's not without many problems that plague much of the sub-Saharan countries, such as coups, economic sanctions, massacres, assassinations, and war. But Shen-Hoover is guardedly optimistic. He believes that if it wasn't for the recent war in the Cote d'Ivoire, the country would be one of Africa's hottest economies, and if by some miracle the highly controversial upcoming presidential election were to go off without a hitch, the country would enjoy a tremendous rebound. As for Ghana, Shen-Hoover is much more optimistic, citing political stability, infrastructure investments, and high commodity prices as being good for the overall economy despite a rather laissez-faire management attitude on the part of a few of the companies he visited. My friend Alice believes that the biggest strength of these two countries lies in the optimism and resiliency of the people themselves.

So, put on your safari hat, grab your elephant gun and let Ryan Shen-Hoover be your guide on an entertaining, informative, and eye-opening African safari: http://www.investinginafrica.net/Portals/0/CI&GhanaTripReport.pdf

Further Information:
Ryan and his partner, Rakesh Gadani, are forming a long-only hedge fund on listed African stocks called the Kivuno Africa Fund. Assuming the paper-work goes well, he expects to open it to investors sometime in May. So far, his fund is up 82% since March 2006 inception. Compare that with a gain of only 7% on the S&P. Interested investors can contact him for a prospectus at ryan@kivunofunds.com.

Here are Ryan and Rakesh's supplied bios, FYI.

Ryan Shen-Hoover. Ryan has a B.A. Sociology (magna cum laude) degree from Eastern Mennonite University in Harrisonburg, VA. He worked as an advocate for communities affected by large dams in the southern African nation of Lesotho from 1997 to 2000. He continued this work upon returning to the United States as a member of International Rivers Network’s Africa Program. In 2006, he launched the Investing in Africa newsletter, a monthly guide for investors with an interest in African stock markets. He has traveled widely throughout southern Africa and is currently a Level I candidate in the CFA program.

Rakesh Gadani. Rakesh holds a B.Sc. Finance (summa cum laude) degree from Elmhurst College in Elmhurst, Illinois. He is currently a Level III candidate in the CFA program. He has been involved in the Kenya (Nairobi) stock exchange since 1990 when it was a small “club”. In 2002, he began to invest in other African stock exchanges. He is an avid reader and a keen follower of politics and economic trends. He has traveled widely within East Africa and currently resides in Nairobi.

Monday, March 24, 2008

Have We Hit Bottom Yet?

I'm back from an extended (and much needed) Easter break and even though the hiatus only lasted for four days, I feel as though I've been absent for weeks. “Rusty” is the word that applies here. So, to ease myself back into the blogging mind-set, I've decided to do a brief market commentary today as opposed to my usual full-blown discourse on something that requires an inordinate amount of brain power.

When I don't have an actual subject in mind, I usually am able to find one simply by perusing the stock charts. What really stood out today is not any one stock in particular, but rather the overall market action--the VIX in particular. You've probably heard the term bandied about by the CNBC talking heads, but do you know what it is and what it means? Chances are, most people don't and I think they should.

So, what exactly is the VIX? The VIX is the CBOE market volatility index and is viewed as a measure of market uncertainty or market risk. The index is constructed from the implied volatilities of S&P 500 index options, both calls and puts. (The implied volatility is a result of the Black-Scholes options pricing formula and is beyond the scope of this discussion.) The VIX is viewed as a leading indicator reflecting investors' expectations of future market uncertainty. Values greater than 30 correspond to highly uncertain markets (like now) while values below 20 correspond to less stressful or even complacent markets. For example, the VIX was range-bound between 10 and 20 during the recent bull market starting in 2003. The VIX finally shot above 20 last July which should have alerted investors that the market was running out of steam.

What is the VIX telling us now? Since last July, it's been forming a triangle pattern, making a series of higher lows that bounce off the 200 day moving average (if viewed on a daily chart). VIX tops correspond to market lows and vice versa. During times of market instability, the VIX provides an inverse mirror to overall market movement. It has already made three bounces off its 200dma. Oddly (or not so oddly), these bounces have also occurred at its Fibonacci retracement levels. The next and last Fibonnaci level is at the 25.50 level which is where the VIX is hovering about today. If it breaks through this level to the downside and especially if it manages to break its 200dma at around 23, then I'd say the probability that the market will enter a bull phase is excellent. Just to be sure, I wouldn't back up the truck until the VIX clears the 20 mark.

Enough about the VIX and Fibonacci voodoo. Is there anything else that the market is telling us? Yep. Today, the Dow Transports (DTX)--a leading market indicator--just cleared minor resistance at 482. If it can break through major resistance at the 492-500 level, then things will really be looking rosy. The other major market indices are also nearing resistance levels on heavier than average volume, so we'll keep an eye on them, too.

Okay, if the market is indeed staging a turnaround, what should investors be putting on their shopping lists? In general, the leaders in previous markets tend to be laggards in the next. For example, commodities have enjoyed a huge run-up and although I do think they might have more upside, they're beginning to look a little tired. Witness the 10% fall in gold in just the last week! The sectors that are starting to show signs of life are the following:

REITs -- real-estate investment trusts which I featured last week
Retail stocks -- Urban Outfitters (URBN), Nike (NKE), and Wal-Mart (WMT) are all posting new highs today
Railroad stocks-- CSX and Genesse (GWR) are at new highs
Computer Architecture--the computer architecture ETF, the IAH, took a nice jump today almost clearing resistance; stocks in this sector that are looking particularly attractive are Ciena (CIEN), IBM, Cisco (CSCO), Apple (AAPL), and Hewlett-Packard (HPQ).

What about financials? Many of them have started to turn around, but I wouldn't be a buyer yet. I think we've got more unwinding to do in the credit market first.

Well, that does it for today. Tomorrow I'm hoping to discuss the exciting and profitable field of emerging markets. Stay tuned!

Wednesday, March 19, 2008

Are REITs Right for Right Now?

It seems as if I struck a nerve with Monday's blog on REITs (Real-Estate Investment Trusts) because suddenly everyone is talking about them. Just a few minutes ago, CNBC reporter Matt Nesto did a piece on REITs saying that according to investment bank UBS, REITs deserve another look. The three reasons he gave are the following:

1. The unprecedented injection of liquidity by the Fed into the housing and mortgage markets. (The Fed just today injected $200 billion into Fannie Mae and Freddie Mac in an effort to ease the credit crunch in the housing market.)
2. In terms of pricing, there's a difference in perception between the stock market and the private market.
3. REITs hold hard assets (buildings) so you can get a price on them.
He also gave the names of UBS's favorite REITs: Boston Properties (BXP), Digital Realty (DLR), Essex Property Trust (ESS) (also in my covered call portfolio), Kimco (KIM), Macerich (MAC), Annaly Capital (NLY), Senior Housing Properties Trust (SNH), Simon Properties (SPG), and Taubman Centers (TCO) which is breaking out today. My two cents on the above: I'd stay away from NLY and DLR for the moment because of their recent volatility. I mean, with so many other good plays in the sector, why expose yourself to unnecessary risk?
And speaking of good plays, here's a list of stocks that are either breaking out today or have recently broken out in order of dividend yield:


As I mentioned on Monday, REITs make a good addition to tax-sheltered accounts because of their generous dividend pay-outs and now is the time to buy them while the sector is in the beginning of its recovery stage. Of course, loading up on a bunch of REITs won't help diversify your portfolio, but if you do select some, you can at least diversify among them. Each REIT has its own niche, spanning the sectors from healthcare, senior living, public storage, entertainment (movie theaters), shopping malls, industrial buildings, apartment rentals, student housing, and other various commercial and residential properties. Are REITs right for you? If you find they fit in with your investment philosophy, now would be the right time to add them to your portfolio.

Update on Monday's REIT covered call portfolio:
On Monday I set up a covered call portfolio composed of six REITs that will all be paying dividends between now and April options expiration. I purchased 500 shares of each of the mentioned stocks at their closing prices and sold 5 ATM call contracts at the last bid prices. (Had I waited a day to write the calls I would have gotten much better prices.) Be that as it may, the total cost of the stocks was $174,930 and the money I received from the calls was $4,560, yielding a 2.6% return. (All prices include $9.95 commission/stock trade and $14.95/options trade.) If everything works out well at April expiration, my calculations show a total gain of about $11,900 giving me a monthly return of 6.8%--yay me! If I were to do this again I would weight the portfolio more equally in terms of dollar value instead of equal share value, FYI.

How are my picks doing? I'm so glad you asked. UDR broke out of its channel yesterday; Entertainment Properties (EPR), AvalonBay (AVB), and Essex (ESS) are breaking out today; and Mack-Cali (CLI) and Developers Realty (DDR) are nearing their breakout points. So far it looks like my covered call portfolio is going to work out quite well--yay me!

Tuesday, March 18, 2008

Quick Fed Straddle Strudel

I mentioned in my January 30th blog about the volatility following Fed interest rate decisions and how putting on a straddle before the rate decision can pay big bucks. This needs to be quick so here are my straddle picks:

On the SPY (S&P tracking stock):
More conservative but more expensive play:
Buy Apr 132 Call SFBDB @ 3.80
Buy Apr 132 Put SFBPB @ 4.25
---------------------------------
Net debit = 8.05/contract

More risky but cheaper play (options expire this Friday):
Buy Mar 132 Call SFBCB @ 1.36
Buy Mar 132 Put SFBOB @ 2.02
---------------------------------
Net debit = 3.38/contract

On the QQQQ (NASDAQ 100 tracking stock):
More conservative but more expensive play:
Buy Apr 43 Call QQQDQ @ 1.30
Buy Apr 43 Put QQQPQ @ 1.58
---------------------------------
Net debit = 2.88/contract

More risky but cheaper play (options expire this Friday):
Buy Mar 43 Call QQQCQ @ 0.41
Buy Mar 43 Put QQQOQ @ 0.76
---------------------------------
Net debit = 1.17/contract

If the Fed doesn't lower by one basis point as expected, I think the market is really going to tank. Even if it does, it still might tank.

Place your orders and let's see how this plays out. I think we're in for a wild ride.

UPDATE at 12:45pm PDT
----------------------------
About 20 minutes before the Fed decision, I placed a limit order for the April 43 straddle on the Qs at 2.90 which was at the asking price. I had to cancel it at 11:13am, two minutes before the decision, because it hadn't been executed! Good thing, too, because I wouldn't have been able to sell the puts at the 11:35am market low, even though today's put option volume is over 2600 contracts. However, had I played the March straddle, I most likely could have bought the spread and dumped the puts at the market low. I know this because my charting program shows me when these trades are executed. So, why did the March straddle work? Well, probably because today's option volume on the March puts is over 68,000 contracts, more than 25 times the April volume.

I guess the lesson here is that you need a tremendous amount of liquidity to be able to execute your trades in a timely manner. Generally, I trade options with a longer time horizon--on the order of hours, days, or weeks instead of in minutes and seconds.

Had I been able to perfectly trade the March straddle, I would have bought the put at 0.75 and sold it at 1.00, and the call at 0.45 and sold near the close for 0.65. The net profit would be 0.45/contract for a 37.5% gain (0.45/1.20 x 100).

Unfortunately, woulda-shoulda-coulda's don't count, but there's always a next time...and next time I'm trading the front-month contracts!

Monday, March 17, 2008

Covered Calls for Your Pot 'O Gold

In regards to last Friday's recipe for covered calls, today I thought I'd put my money where my mouth is and research some prospective covered call candidates for your retirement account. Well, if there's one golden rule about research it's this: It takes twice as long and is half as easy as you think it's going to be. Blarney! I was hoping to be done by market close so I chug green beer and dance a few jigs at my local Irish pub, but I guess that will have to be put on hold--aargh! On the bright side, I did find some gold at the end of my research rainbow which will hopefully give you some ideas for your retirement nest egg.

Here's the criteria that took me so long to research:
1. Find optionable stocks with dividend yields > 3%.
2. Make sure those stocks are not in a downward price spiral--that is, their charts don't suck.
3. Make sure these stocks have liquid options. (Looking for open interest > 100 or so.)
4. Make sure these stocks pay a dividend between now and April options expiration (4/18).

Dividend stocks were selected for two reasons: you can write covered calls to gain income in your tax-sheltered account with the dual benefit of deferring taxes on both your capital gains and dividends. I like that concept.

I found six stocks that fulfill the above criteria. The bad news is that they're all REITs. Warning: I have eyes in the back of my head and I know what you're doing--you're holding your nose and thinking I've just taken a dive off the deep end with cement-reinforced boots, but give me a second and hear me out. Sure, real estate has been in the toilet but the REITs have been holding up pretty darn well considering the current rotten market environment. If you look at their charts, the bad news has already been priced in. Lately, they've all been trading sideways with an upward bias--just the type of price action you want for covered calls. The major caveat here is that if you do buy all of these, Jim Cramer will slap you on the wrist for not being properly diversified.

For simplicity and space considerations, I've summarized the stocks on two charts. The first one summarizes dividend information giving current yields, dividend price, the ex-dividend date (the date on or before which you'd need to buy the stock to receive the dividend), and the date the dividend will be payed.

The second chart gives the expected returns on covered calls. Expected returns are derived from today's stock closing prices using the option's last bid. You could increase your return by placing limit orders someplace between the bid and the ask price and praying that it gets executed. (Options are sold at the bid and bought at the ask.) Note that commission costs are not included, and if you're only trading one or two contracts, these costs will make a dent in your return figures. The way around this is to obviously trade more contracts.

That's it for today. We'll be checking in with this portfolio in the next few weeks to see how it's progressing. May the luck of the Irish be with all your trades!

Happy St. Paddy's Day!

Thursday, March 13, 2008

Sovereign Bank- An Inverse Head & Shoulders Pattern in the Making?

Last week we discussed the powerful head and shoulders chart pattern along with a few recent examples. This bearish pattern is a sign of impending breakdown following an extended run-up in price. The formation is relatively rare and one that is much coveted by traders since it has a high probability of working. Even more rare is finding its opposite, but I believe I found one today. It's pretty easy to spot this pattern after it's already happened and what excites about this chart is that it's still in process of setting up. This will give us time to see if it completes the formation and to profit from it if it does.

What is my discovery? It's a chart of Sovereign Bancorp (SOV) which I found while persuing stocks in the beaten up financial sector.


An inverse head and shoulders formation is a bullish pattern which occurs after a steep decline in price. A steep decline is crucial to the setup and clearly we've got that. The left shoulder was formed on Nov. 27th on volume of about 10.6 million shares, the head formed on January 22nd on 9.7 million shares, and the right shoulder was recently formed on March 7th on volume of 6.2 million. Each successive formation must occur on decreasing volume, and that's the case here. So far, so good.

As you can see, the formation is fairly symmetrical. The shoulder peaks occur right at the $10 level. The neckline is the line drawn between the shoulder crests, around $13.30. Today the stock is bouncing off its $10 shoulder support. If you're short the stock, now would be a good time to cover.

So, when should we look to jump in with our long positions? Assuming the pattern doesn't breakdown, we'll look to go long just after the stock rises back to the neckline level and breaks through it. I'm estimating this will occur sometime near the end of this month or the beginning of the next. If it does, our entry point will be just above $13.30 with a price target in the $17-$18 range. (The target price is the neckline price (13.30) plus the difference between the top of the head and the neckline (about 4.6).) A weekly chart of SOV shows that it has a major resistance level near $17.25, so it needs to clear that first before it can head higher.

If this pattern plays out and you buy the stock just above the neckline, you can expect at least a $4 gain which translates into a 30% return on your investment. Fortunately for all you options players, SOV offers a liquid options playing field meaning there's a lot of open interest in near the money strikes. Buying call options increases your leverage thus magnifying your return. Okay, so what options should you buy? Since it might take a month or so for the stock to reach its price target, buying the July 12.5 or 15 call options will offer the best bang for your buck. If you're feeling extra bullish, you can also sell a bull-put credit spread (say the April or May 15/12.5) to offset the price of the calls.

Add this stock to your watchlist, set an alert for 13.30, and let's see how this puppy plays out!

Update on Yesterday's Heavy Metal Stocks:
JOYG broke its $70 resistance level today. Yesterday I got an email from my girlfriend who's a VP at the company and she says business is going gangbusters and they're in the middle of a hiring frenzy. Thought you'd like the heads-up.

Wednesday, March 12, 2008

Heavy Metal - Stocks that Rock

My analyst Dimitri works with fingers planted on the keyboard and his head plugged into his iPod with Guns 'N Roses and Kiss blasting into his brain. He claims that the “music” helps him concentrate but I think he does it partly to tune me out. Ah, well...I can't really blame his preference to heavy metal versus my rantings. I asked him if perhaps some soft jazz or classical wouldn't be more conducive to concentration, but he just shook his head and gave me the same smirk that the teenage bag-boys in the grocery store give me. So what if I am a bit of a fuddy-duddy?

But it got me thinking that heavy metal might be a timely subject for today's blog especially when I read this morning that heavy-equipment maker Caterpillar (CAT) projected $60 billion in revenues by 2010 compared with previous estimates of $45 billion. That's a 33% increase in guidance! And it's not just CAT--all of the stocks in the heavy machinery group have been performing well. Wall Street analysts have given the industry an enthusiastic thumbs up for the next several years at least, citing an increasingly voracious appetite for mining, infrastructure, and agricultural products on a global scale. Since the dollar is expected to decline at least until the credit crunch is resolved, companies with international exposure in these areas will likely fare better than their domestic counterparts, especially in a recessionary market.

So what companies can be expected to do well? Here's my list of prospective candidates.

Agricultural Machinery
Deere (DE):
Deere manufactures a long list of agricultural equipment, from tractors and tillers to irrigation equipment. It recently purchased 50% of a Chinese equipment maker thus expanding its presence in that country. According to a UBS report, the U.S. Department of Agriculture expects 2008 farm income to be up 4% from 2007 levels and up 51% from the prior 10-year average. Jim Cramer praised the company's CEO saying that Deere is well-positioned to profit from the continuing worldwide upgrades in farm equipment. The stock has been trading in a tight range since the end of January. If it breaks its $90 range high, that would be a signal to start buying up shares. If it breaks its previous all-time high of $95, then I'd look to jump in with both feet. The company's next earnings release is May 14th and it does pay a modest dividend.

Lindsay Corp. (LNN): This company services both the agricultural sector with its irrigation equipment and the infrastructure sector with its traffic management and safety devices. It has wholly owned subsidiaries in Europe, Africa, and South America. Net revenues and income have been increasing dramatically on a year-over-year basis. The stock is trading 9% off of its recent high and right now it's hard to tell exactly where it's headed. If it breaks its high of $80, then I'd be tempted to step in. The company reports earnings on March 19th and it pays a small dividend.

Infrastructure
Caterpillar (CAT): CAT is also a multi-sector play, providing heavy equipment and equipment rentals to all of the above mentioned sectors with emphasis mostly in infrastructure and mining. The stock gapped up this morning when the company upped its sales forecast. It also expects earnings per share to grow between 15% and 20% through 2012 due to “significant new infrastructure growth opportunities in the world's emerging markets and a need for infrastructure reinvestment in North America and Europe,” according to the company's CEO. CAT is expanding its presence in China as well as its service parts distribution network in the US. The stock has been in a decline since last August until this January when it staged a turnaround. Today it broke short-term resistance, but I wouldn't jump in yet--wait until it surpasses the next resistance level of $77.50. The company reports earnings sometime in mid-April and it too pays a dividend.

Manitowoc (MTW): This company has three separate divisions, one of them being cranes, cranes, and more cranes. The revenues generated from worldwide crane sales account for 84% of company revenues with orders backlogged for over a year. Just yesterday it announced a joint venture with a Chinese crane manufacturer and expects its emerging market crane sales to hit the $1 billion mark in 2008 with total annual sales topping $4.1 billion. Despite a slowdown in US construction, domestic crane sales should remain strong since only 6% are related to commercial construction and a mere 1% to residental construction. The stock has been steadily rising since January but it needs to make a new high (above $44) before I'd be a buyer. Earnings are scheduled for April 28th and the company pays a small dividend.

Mining
Bucyrus (BUCY): Bucyrus designs and manufactures equipment for both surface and underground mining to mining centers on virtually every continent. It also provides replacement parts and servicing for its equipment. Just today Zack's, the independent advisory firm, added it to its buy list citing an average earnings surprise of more than 15% for the last four quarters and an increase in this quarter's earnings estimates. The stock has been steam-rolling straight up the chart, gaining 620% since inception in late 2004--zowie! (Too bad Zack's didn't rate it a buy back then.) Chart volume suggests that institutions may be lightening up on their positions as evidenced by strong selling on down days. The stock is currently trying to push past its recent all-time high of $112 and if it can manage that, then I'd become a buyer.

Joy Global (JOYG): One of my childhood girlfriends joined JOYG when the company was then called Harnischfeger. She's now a vice president and the company is now Joy Global--both good things, particularly the latter since not only was the previous name a mouthful to pronounce but even tougher to spell. (It's a word that might even stump the national spelling bee champion.) The company's focus is similar to Bucyrus's (mining equipment with worldwide sales), and both are located in Milwaukee (and Manitowoc is close by, too--go Badgers and Packers!). Sorry. Yesterday, the company not only reported stellar earnings but an order backlog extending into 2010. Had you bought the stock at its low five years ago, you would have enjoyed a nice 1600% gain on your investment. (Hm, next time I see my girlfriend she's picking up the lunch tab.) The stock has been trying to punch through major resistance set by its all-time high of $70 back in 2006, and any breakthrough on decent volume would be a strong buy signal.

I guess I have to be grateful (dead) for Dimitri's choice of music because if it wasn't for him, I wouldn't have thought of investigating these stocks. I hope Wall Street is correct in assuming that these companies will outperform the market over the next several years for I would like to see them all do well, especially the Wisconsin-based ones. As a native-born cheesehead, I'd like the state to be known for something more than beer, brats, tacky foam hats, and the Packers, not that there's anything wrong with that (except for the foam hats--they're just plain embarrassing).

"I wanna rock 'n' roll all night...and party everyday... " Dimitri's music is starting to get to me--help!

Monday, March 10, 2008

Contra-band: The Longs and Shorts of Contra-ETFs

On Friday I mentioned Contra ETFs as a way for conservative investors to hedge their portfolios in falling markets. For all of you novice investors, an ETF is an acronym for Exchange Traded Fund. Think of it as a mutual fund that trades like a stock, which is exactly what it is. The beauty of ETFs compared with mutual funds is that getting in and out of them is a lot easier since you don't have to wait until the end of the day to open or close your positions. The Spiders (SPY) and the Q's (QQQQ) are examples of ETFs that are activley traded and widely held. With that said, let's look at contra ETFs in more detail and discuss the best way to use them.

What is a Contra ETF?
A contra ETF is just what the name implies: It's an ETF that uses instruments that inversely mirror the movement in its underlying index or sector. There are two types of contra ETFs--short and ultra short. A short fund tries to exactly mirror the inverse movement of its underlying instrument while an ultra short fund mirrors twice the movement of its underlying. As an example, let's compare the SH (Short S&P 500) with the SDS, its ultra short counterpart. Since last October 11th's market high, the SH gained 21% while the SDS doubled that to 43%. Sounds great, eh? It is great when the market is going in your favor, but if it starts to go against you, the downside to the ultra short fund is magnified.

Contra ETF Characteristics
All ETFs trade on the AMEX (the American Stock Exchange). Some are optionable, some are a lot more liquid than others, and most of them pay dividends. The majority of contra funds are offered by a company called Proshares. (For a complete list of their products, please visit their website: http://www.proshares.com/.) Rydex has a few, too. Here's a list of the most active contra funds (those trading more than 150,000 shares/day) in order of decreasing volume along with their dividend yields:

[Note: All of the above ETFs are optionable except for the bottom three (PSQ, EFU, and SDD).]

How to Play the Contras
These funds can be used either for portfolio hedging or for speculation. If you're using them as a hedge against portolio risk, you would use them the same as for any hedging techniques. (See my recipes on portfolio hedging.) You would buy them at market tops or when the market is just starting to turn around. How much do you need to buy? That's entirely up to you, but if you want to maintain a market neutral position, you would need to buy a dollar amount equal to half of your long position in the ultra short ETF. For example, if you have $100,000 to invest, you would need to buy $33,000 in an ultra short ETF that mirrors your portfolio (say the S&P 500) and keep $67,000 in your long stock positions. If the market drops 10%, you would lose $6700 in the value of your stocks, but your SDS position (the UltraShort S&P) would increase by $6600, not including the dividend that it pays. You should also note that if the market keeps on dropping, you'll need to sell some of your SDS shares to maintain your neutral position to avoid being overweighted on the short side. The risk to this strategy is if the market goes up, you'll start losing money faster.

The other way to play these is for speculation. You think the market is going down and you want to profit from it, but you don't like the concept of shorting, you don't understand how to play put options, or you're trading in a non-marginable account (like some IRAs). Here you would just buy the ETF you liked the best and set your stop/loss point just above the value of the underlying's major resistance. For example, if you bought an S&P contra ETF today, your stop/loss point would be when the S&P crosses its 1300 resistance level.

Which of these funds do I like the best? I have to say that the chart of the QID, the UltraShort Qs, is the most compelling. It's been range-bound since the middle of January and just broke out today. I would ride this down at least until the OEX (S&P 100) tests its 565-570 resistance level. It's interesting to note that the contra ETFs in the energy and basic materials sectors (DUG and SMN) are showing signs of life. Perhaps these sectors that have been so stellar recently are starting to run out of gas? (Pun intended) If you're overweighted in these areas, now may be the time to put on a little protection and purchase these contra ETFs.

Friday, March 7, 2008

Blog Round-Up Day

If anyone out there remembers the original Mickey Mouse Club (the one with Annette in it), you might recall that every day of the week had a different theme. Monday was “Fun with Music Day” (my least favorite), Tuesday was “Guest Star Day”, Wednesday was “Anything Can Happen Day” (my fave), Thursday was “Circus Day”, and Friday was “Talent Round-Up Day.” Following that theme, I thought we'd do a follow-up on several of my previous blogs, namely the earnings news strategy, the royalty trusts, and the retailers.

But before we begin, I want to comment briefly on the current market ugliness. If you still don't think we're in a recession, the fact that all of the major indices just broke major support should confirm it. Even the all-important Dow Transport Index, a leading indicator of over-all market direction, broke down. The volatility index (VIX) gapped up continuing it's pattern of higher lows. What's a worried investor to do? If you still have long positions, lighten up your holdings and tighten up your stops 'cause we're in for a bumpy ride at least until the indices test the next resistance level (1235 on the S&P). If you're squeamish about shorting stocks, at least find out about contra-ETFs. They offer downside protection without having to open up a margin account. [Note to self: Do a blog on contra-ETFs.]

Royalty Trust Update (see Feb. 19 blog)
Wow, have these guys been performing! My favorite pick at the time, Permian Basin (PBT), has been the clear winner, up 19%. My second fave, BP Prudhoe (BPT), is up 11%. Jim Cramer picked up on these stocks on March 5th. He likes the ones I mentioned along with Hugoton (HGT) which has also been an advancing juggernaut. Of the others I mentioned, SBR and CRT are threatening to break overhead resistance as we speak. Williams Coal (WTU), the dog of the group back then, is now turning into a leader and is threatening to break-out. (Who knew?) As long as oil and energy do well, so will these. Remember too that the beauty of these trusts are that they pay generous dividends (8-13% dividend yield) and make great assets to any tax-sheltered accounts. (Disclaimer: One of my funds owns PBT.)

Retail Stocks (see Feb. 13 blog)
Higher consumer prices and lower consumer confidence has shoppers shying away from apparel and moving into the lower-end retailers. Although Wal-Mart just announced a dividend increase and reaffirmed guidance, the stock remains range-bound. Today, it's looking like it might be heading lower along with the other best-of-breeds, Urban Outfitters, Buckle, Aeropostale, and Gymboree. I can't find one chart in this group that looks compelling. The best course of action is to wait until the economy shows signs of turning around before jumping in.

Earnings News Portfolios (see Feb. 28 blog)
Last week I outlined a strategy for playing companies just after their earnings are released. I created two mock portfolios each consisting of five stocks; the long portfolio was made up of companies that blew away their earnings estimates, and the other was a short portfolio of those whose earnings came in worse than expected. Since these were short-term plays, I closed out both portfolios yesterday for a total return of -2% on the longs and +22% on the shorts. (I have my portfolio manager set-up to sell when a stock hits a 10% loss, so that I sold HURC and CTRP in the long portfolio a few days ago.)

Does this mean that my criteria for entering the long positions were invalid? No, it absolutely does not. What it does mean is that even good stocks that have just reported great news cannot fight the overall trend of their sectors and of the market in general. If any one of the stocks had been in a rising sector such as materials, metals, or energy, no doubt they would have done well. I do think that this strategy is a good one, good enough in fact to qualify for its own recipe in the Stock Market Cook Book, but with the added caveat that one only plays it according to the overall trend of the market, i.e. only go long in up markets and short in down markets-- a good rule of thumb in general.

Enjoy your weekend!

Thursday, March 6, 2008

Head & Shoulders Patterns - Examples & Strategies

Yesterday we looked at two powerful chart reversal pattern indicators, double tops and head-and-shoulders patterns. I mentioned that I would try to find some recent examples of a head and shoulders pattern, and I did. Let's see how they fared.

The first is Stanley (SXE). It began forming the left shoulder at the beginning of last November and completed its pattern when it fell below the neckline level of $30 almost three months later. Note that volume levels surged at the top of each peak with each succeeding volume level being less than the previous one. At the top of the head, the price was around $38, so we would expect a price target of around $22 ($30 - $8). The price did reach a low of $22.68 on February 14th (Happy Valentine's Day!) before it turned around.

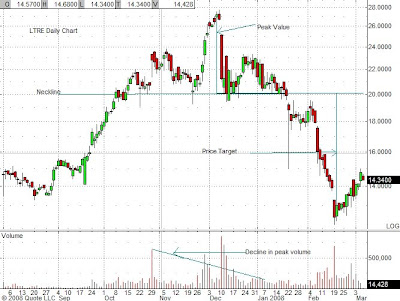
The next example is Learning Tree (LTRE). The left shoulder began forming in the middle of October, the head formed two months later, the right shoulder about three weeks after that until the neckline was finally broken by a downward gap on January 22nd. The peak to neckline value was $7 giving our price target of $13. This value was exceeded by the climactic low on Feb. 19th when the stock bottomed just above $12.

You can see that both stocks exhibited all of the criteria for a successful head-and-shoulders pattern: 1. The shoulders are roughly symmetrical and of the same height 2. The volume at each successive peak declined 3. There was a big run-up in the stock prior to reversal.

Now that you can identify this pattern, let's look at some strategies that will help you make the most out of this situation. One strategy is to simply short the stock when the price breaks the neckline and exit when it approaches its price target (If the stock doesn't quite reach it's target and the price is reversing on heavy volume, cover your position.) A better and much more profitable strategy is to buy put options. Let's compare the two.

Suppose you shorted LTRE when it broke support at $19/share and covered 19 trading days later when it exceeded its price target, say at $12.50/share. The net result would be $6.50/share, or $650 on a $1900 investment. That's a 34% gain on your investment or a 450% annualized return. Pretty darn good!

But what if you had purchased puts instead of shorting the stock? Well, unfortunately neither of the above-mentioned stocks are optionable so I'm going to have to do a rough comparison using my handy-dandy Black-Scholes calculator to compute options pricing. In the case of LTRE, had you purchased the April 20 puts, the cost would have been roughly $1.85 and you could have sold them for $7.40, a gain of $5.55/contract. Assuming you have the same $1900 to invest, that means that you could have purchased 10 contracts at a total cost of $1850. Your realized gain would then be 10 x 100 x $5.55 = $5550, a return of over 300%. The annualized gain in this case would be a whopping 3950%! If you're in an especially greedy mood, you could also write a bear-call credit spread (e.g. buy an April 25 call and sell an April 20 call) at the same time you buy the puts. The credit you receive from the spread will offset the price of your puts thus increasing your return even more. No wonder traders love this chart pattern!

I hope you now have a clearer picture of how head-and-shoulders patterns work and a few ways to play them. When I find stocks that are setting up in this pattern, I'll let you know and hopefully we can both profit.

It's a beautiful day and Fifi wants to tidy up my desk, so I think I'm going to take a long walk on the beach with Moondoggie. Toodles!

Wednesday, March 5, 2008

Cooking Tools #1: Chart Pattern Reversals

Continuing with yesterday's introduction to chart patterns, today we'll be looking at chart pattern reversals. These are useful tools in determining when a stock may be setting up for a reversal in price trend. Included in this discussion are double tops and bottoms and head-and-shoulders (not to be confused with the dandruff shampoo). Other reversal patterns include broadening formations and triangles, but they're not as easy to spot nor are they as reliable.

Since there are many books and websites that discuss these patterns in depth, I'm only going to touch on the salient points so that you will be able to identify them and know what to do when you see one.

DOUBLE TOPS & BOTTOMS:
A double top or bottom looks exactly what it sounds like. A double top looks like a rounded M and a double bottom looks like a rounded W. For simplicity, I'll discuss the characteristics of a double top; the commentary for a double bottom will be the reverse.

Characteristics: A double top occurs after a significant run-up in the stock, usually on the order of months or even years. The pattern is composed of two peaks of roughly equal height (they should be within 3-4% of each other) with a trough of about 10-20% off the peak high in the middle. The distance between the two peaks can be from several weeks to several months; too close and this could just represent normal resistance rather than a lasting change in the overall supply and demand. Once you learn how to spot a double top you'll know the difference between a minor fluctuation and a major reversal pattern.

How to play it: After the second peak has formed, the stock will decline on increased volume and/or experience downward gaps. What you want to do is wait and see if it will break the support line which is the horizontal line that goes through the peaks and touches the base of the trough. If it does break this line, it must do so on increased volume. A general rule of thumb is to wait a few days after the break before entering a short position (or selling the stock if you were long) to see if the break is real. Once the support line is broken it becomes resistance, and any retracement back to this line can be viewed as another chance to exit your long position and/or initiate a short one.

Price target: Subtract the peak value to the support line from the support line for a price target: Price Target = Support Value - (Peak value - Support Value). It follows then that the bigger the double top formation, the lower it can be expected to go. If you had shorted just below the support line break, you can expect to cover when it reaches its price target.

HEAD & SHOULDERS:
A head and shoulders pattern is one of the most powerful and reliable chart reversal tools. It's very smiliar to a double top except that it has an additional higher peak called the “head” located between the two lower peaks called the “shoulders.” The “neckline” is the support line drawn at the base of the troughs joining the head and shoulders. This line doesn't have to be horizontal; a sloping line is okay. Volume is crucial here. The volume of each successive peak must be less than the volume of the previous one. Overall, the volume should experience a significant decline during the course of pattern formation. If you have both the shape and the volume criteria, then you have correctly identified this powerful reversal pattern. Head-and-shoulder patterns typically take a couple of months to set up, although some can take longer.

How to play it: You play this exactly the same way as a double top.

Price Target: The price target is the same as in a double top except that you'll be using the top of the head as your point of subtraction: Price Target = Neckline (support) value - (Top of Head value - Neckline value). Note that other considerations can come into play when establishing a price target such as major support and resistance levels, Fibonacci levels (don't worry too much about that right now), and major moving averages.

Note: Since this pattern is so reliable, it is also very profitable and much coveted by traders. It is also a rare one, but I'll see if I can dig up a few stocks that are exhibiting this pattern so that we can follow their price action.

Tuesday, March 4, 2008

Getting Technical-Introduction to Chart Patterns

Yesterday on CNBC's Fast Money program, master chartist Louise Yamada gave her views on where she thinks the market is headed. She showed a multi-year chart of the S&P 500 and said that the (head and shoulders) break of its 1400 support level in early January marked the beginning of the downturn. How far does she expect it to go? Based on the triangle pattern that began near the end of last November, she feels that it can go as low as 1200. She arrived at this number by taking the difference between the November 26th price of 1407 and subtracting it from the December 11th triangle high of 1523 and then subtracting that value (116) from the beginning price (1338) of a new triangle that began forming on January 23rd. I have to say that I think her analysis might be correct. Last Friday, the S&P broke out of its current triangle pattern and is heading down. It's nearing the 1310 support level and if it breaks that, then I believe nothing will stop a drop at least until it reaches the next major resistance level at 1235-1240.

Well, that's all fine and dandy you say, but isn't technical analysis just a bunch of voodoo? Yes, it is, but only when you don't know what you're doing. My goal is to introduce you to some basic concepts so that you will have a better knowledge of why your stocks are behaving the way they do and be able to predict what they might do in the future. Knowing how to spot price patterns, you'll learn how to identify entry, exit, and stop/loss points. Isn't that worth the price of a little education? I hope you'll agree with me that it is, or at least keep an open mind about it.

Over the next few weeks we'll be looking at price reversal patterns and price continuation patterns. A head and shoulders pattern indicates a price reversal and triangles, pennants, flags, and wedges give indications of either a price reversal or a price continuation, depending on certain conditions. These sound like formidable subjects involving a lot of math, but if you know the difference between a rectangle and a triangle and can add and subtract, then you've got all the tools you need. If you don't, then your intelligence deserves to be insulted. And I'll do my part by trying to keep it as palatable as possible. Deal?

Earnings Portfolios Update:
Good News Guys:
Down 2.6% (since inception). VISN has been the clear winner, gaining over 11%. HURC is still the biggest loser, down 13%. Had I owned it, I would have dumped it yesterday when it broke it's Thursday's low.
Bad News Bears: Up 20%. Thanks to recent market bearnishness, all of these stocks have been winners. However, the steam seems to be evaporating from all of them, and if I actually held these positions, I'd be sorely tempted to exit them all right now. Hey, a 20% gain in 4 days ain't chicken feed--that'a a 1250% annualized return!

Monday, March 3, 2008

Can You Trust Your Charting Program?

Eke!!! That was the cry I heard last Friday afternoon from Fifi, my ex-Wall Street analyst turned domestic dominatrix. Not only does she rule over my household but she also has the task of shoring up my stock portfolios at the end of the day. Not that I expect her to do it--she just enjoys it. I think it's her way of keeping up with the market and giving me a little break. (She does have her soft moments but she'll never admit to them.)

From the sound of her cry you would have thought she was being attacked by a fifty foot rodent with a taste for French tarts, but it was something more sinister than that. She found major discrepancies in the end-of-day stock prices as quoted from my real-time charting program compared with what my online portfolio management program reported. She also found that what was given as the last trade on a real-time chart wasn't what was reported as the final trade in the corresponding quote sheet where real-time profits and losses are calculated. I'll outline one actual example that should give you a clearer picture of what I'm talking about.

As my faithful readers already know, last week I constructed two portfolios--one to track stocks that reported earnings on good news (a long portfolio) and the other to track those that reported earnings on bad news (a short portfolio). Comparing end-of-day data, Fifi found discrepancies among four of the five stocks in the good earnings portfolio. Hurco (HURC) in particular showed a major discrepancy. My charting program gave the last quote in its quote sheet as $47.90 while the portfolio management program gave $44.22, over an 8% discrepancy! Looking at the last trade of HURC on the chart, I saw that it was $44.38, certainly a lot closer to $44.22, but not even close to the quote sheet price. What went wrong and who was right?

First I called the portfolio management software company. They said they receive their end-of-day data from a large brokerage firm. Checking with two other independent data sources (one being Yahoo! finance), they were able to confirm their numbers. Whew! At least I have confidence that my portfolio profit and loss numbers are being calculated correctly. Then I called my data service provider. They admitted the discrepancy between the quote sheet and the final trade on the chart and said "they would look into it." As to why their end-of-day data doesn't jibe with everyone elses's, they said that I wasn't running the latest version of their software (which just came out and which Dimitri forgot to install), so that could be the problem. I'll know for sure tomorrow when I compare the two software versions.

I really hope my data provider resolves the problem between the chart and the quote sheet values because errors of this sort can have consequences as to what course of action one should take. In the case of HURC, the loss should have been 8.2% as opposed to the 0.5% loss given in the quote sheet. If I were an investor operating with tight stop/loss triggers and had I seen the correct number, I might have entered a sell order at today's market open which would have spared me another 7% loss today.

Bottom Line: What does this seemingly trivial error mean to you? It means that even software that has been around for many years and used by perhaps hundreds of thousands of users can still have errors--errors that could potentially be detrimental to the value of your portfolio. Although it's a pain in the keister, you might want to periodically check the price of your holdings against an outside data source, especially if you're trading intraday.

Earnings Portfolios Update: Today our Good News portfolio is down 4.5% since Thursday with Hurco being the biggest loser, dropping a total of 13%. The Bad News Bears are triumphing with a 17% overall gain. ABH and RHD have been dropping faster than Jimmy Hoffa's body in the East River, gaining a total of more than 28% and 34% respectively.

I just hope I can trust these numbers!