Monday, December 29, 2008

MANDA Update: Rohm & Haas (ROH) falls sharply on bad news

First is was the failed merger of BlueGreen Corporation (BXG) and now it's chemical company Rohm & Haas (ROH) that is putting new pressure on the MANDA portfolio. The stock dropped over 20% today on news that take-over company Dow Chemical (DOW) lost a $17.4 billion joint venture with the government of Kuwait. Although the lost venture takes away important financing, the acquisition is not contingent on it. The transaction is fully financed by a one-year syndicated bridge loan and convertible preferred investments by Warren Buffett and the Kuwait Investment Authority.

However, that doesn't mean that the terms of the deal couldn't be lowered. If that's the case, I'll most likely end up losing money on the trade. But I'm not going to sell the stock now because I believe that I've already lost as much as I think can be lost and there's no where for the stock to go but up. I've been wrong before and I'm sure I will be wrong again but the mid-$50 range is a strong support level for the stock. (It's been trading at or above $50 from the end of 2006 until just a month prior to the take-over announcement where it sunk to $45.) Also, Rohm & Haas management is committed to getting the deal done and most Wall Street pundits think it will go through.

On the negative side, take-over company Dow Chemical was downgraded earlier this morning from overweight to equal weight at Barclay's. The combined bad news sunk the stock to $15 representing a low not experienced since 1991. Ouch! Adding salt to the wound, open interest in Dow put options has increased which is typically a bearish sign. So, if any of you out there are considering taking a bullish position in either company, I strongly suggest to tread lightly and not commit an excess amount of capital to the trade. Note that if the merger does go through at the original price of $78/share, you will realize a whopping 45-55% return on your investment had you purchased Rohm & Haas stock today. In this case, the potential return just might be worth the initial risk.

What is ironic is that of all of these mergers, I thought that this one would be less risky because of the large capitalizations and reputations of the entities involved, but if we've learned anything from the Bernie Madoff scandal, size and reputation don't mean much anymore. Let's keep our fingers crossed this deal goes off!

Wednesday, December 24, 2008

Season's Greetings!

Snow laden Covered Pine Trees

Merry Christmas and Happy Hanukkah from all of the elves at the Stock Market CookBook!

Tuesday, December 23, 2008

MANDA Portfolio Update 12-23-08

Here are the updated Manda Portfolio holdings and realized returns.

Click on image to enlarge.

Another MANDA addition: American Land Lease (ANL)

Bad year for M&A activity
The fact that 2008 has been a bad year for mergers and acquisitions is a “duh” type of statement, but the extent of withdrawn deals is noteworthy because it is unprecedented. According to a Reuters article published this morning, M&A activity is down 35% globally with over 1100 deals canceled which is 300 more than were canceled last year. Estimated total value of the withdrawn deals is around $800 billion with underwriting banks losing more than $815 million in fees. JPMorgan-Chase (JPM) and Goldman Sachs (GS) lost an estimated $73M and $64M in fees respectively. Guess they really did need a bailout.

Brighter prospects for next year
The good news is that many M&A experts feels the worst is behind us and things can only get better. Hoping that will be the case, I took another plunge into the M&A market and picked up some shares of American Land Lease (ANL) today at $13.30 per share. The proposed acquisition was announced a couple of weeks ago on December 10th. Expecting to close in the first quarter of next year, the all cash deal is for $14.20 per share. Just after the merger was announced, ANL was trading around $12.60. Although the terms of the deal sounded viable, I was skeptical for two reasons. The first was that market volatility as given by the VIX was still extremely high and I wasn't sure at the time where it was heading. (Market volatility measures not only market risk but lately has been paralleling credit risk.) The other reason was that I got burned previously on another real-estate acquisition—BlueGreen Corp. (BXG)--that didn't pan out and I wasn't eager to make a similar mistake. (It was one of those canceled deals.)

So what changed my mind?

What changed my mind was the fact that ANL's stock price has been steadily rising on much heavier than normal volume ever since the deal was announced. (Average daily volume is 83000.) Most likely this is the result of the terms of the deal which states that the acquiring company, private equity firm Green Courte Partners, must own at least 88% of ANL's outstanding shares. This reassured me that Green Courte seems to be serious about the acquisition and gave me enough courage to buy the stock today. If the deal does go through in the next month or so as projected (keeping my fingers crossed), I expect to make a tidy 6.8% profit which translates into an annual return of roughly 80%.

Other MANDA news
The current MANDA chart listed under the MANDA portfolio is not up-to-date. The return values don't reflect recent dividends. It'll be updated later today and include the addition of ANL.

Monday, December 22, 2008

More on the Santa Claus Rally

Last Thursday's blog was devoted to the Santa Claus rally characterized by a year-end surge in stock prices. We saw that there does indeed seem to be a rally in stocks just before Christmas so I thought that I'd research this phenomenon further over the weekend in between my holiday cookie baking marathon.

Evidence for a Christmas rally...
Using daily opening and closing prices for the past 15 years on the S&P 500 (which was as far back I was able to go), I was able to generate the following tables. Table 1 shows the price percentage gain or loss for the four trading days before Christmas Day (X-4 to X-1) and for the next six to seven days following it. Most years had four trading days in between Christmas and New Year's except for 1993 and 1999 which had five and is the reason those two years have an extra data point. You can see from the table that there does seem to be a statistically significant rally for the two to three days prior to Christmas with the second to last day (X-2) outperforming the others and at lower risk (risk is given by the standard deviation).


Table 2 summarizes several year-end trading strategies. You can see that the market rallies 80% of the time for the three days before Christmas, gaining on average 0.64%. Even better is holding onto this position and riding it out until the close of the second trading day after Christmas (from X-3 to X+2). Here, the average gain increases to 1.12% and at lower risk to boot. Nice!


...but little evidence for a New Year's rally
These tables also show that as New Year's approaches, the number of days closing in positive territory decreases. It's reasonable to expect the last trading day of the year (X+4 in most years and X+5 in 1999 & 1993) to be down since that's when most investors and fund managers exit the last of their losing positions. The first trading day of the New Year (N+1 in Table 2) is generally lackluster—possibly due to the hangover effect? But the day after that is a barn-burner, up over 0.5% on average nearly three-quarters of the time.

Conclusions
Although there's quite a bit of noise to these data, the fact that the market does rally over the Christmas holiday 87% of the time (only two down years in the past 15) is statistically significant. The best way to play it would be to enter a long position (S&P futures, index options or the SPY tracking stock) on the third or second trading day before Christmas with the intention of exiting near the close of the second trading day after Christmas. It may not be the perfect holiday gift but it's a lot better than a lump of coal in your stocking!

Thursday, December 18, 2008

Yes, Virginia, there is a Santa Claus Rally

As a Christmas gift to my faithful readers, I was looking forward to doing a blog on the Santa Claus rally to see if there really was one. In case you don't know what that is, the Santa Claus rally is typified by a surge in stocks that occurs in before Christmas to just after New Year's. Explanations for this phenomenon include holiday-induced optimism, people investing their year-end bonuses, gift money, and the fact that the kill-joy Wall Street pros are off skiing in Aspen.

So, is this a real rally? According to a web article published last year by the CXO Advisory Service, results of data collected for the day before Christmas to six trading days after Christmas showed little evidence for a Santa Claus rally; however, their data seemed to suggest abnormal strength just before Christmas as well as for a day or two after the New Year. I wanted to see for myself if their assertions were true so I went back and examined the chart of the S&P 500 for the days before Christmas as well as the days after New Year's. Here's what I discovered.

The days before Christmas
The last trading day before Christmas closed up four times, with three of the four days occurring in 1998, 1999, and 2000. (The other up day was 2007.) It closed down three times but only slightly and the other three times were essentially flat. Not very exciting news. However, in nine of the past ten years, the market did go up just before the last trading day, which is statistically significant. My data show that the market rose for the preceding two days three times and the preceding three days twice. The other four times it went up for periods lasting up to seven days. [One way to play this would be put on bullish strategies (buy the SPY or index call options) two to three days in advance of the holiday (like next Monday) if the market opens up.]

The days after New Year's
I looked at the first trading day after New Year's for the past ten years and found that there were six down days ranging from -0.1% to -2.8% (in 2001), three up days ranging from 0.6% to 3.3% (in 2003), and one day that was essentially flat (1999). The days following the first trading day of the New Year were evenly split with five up periods and five down periods. These data are not statistically significant.

Conclusion
We can conclude that a pre-Christmas rally seems to be more than just a coincidence but there is no evidence from ten-year data to support a New Year's rally.

Wednesday, December 17, 2008

Correction to yesterday's blog

In yesterday's blog concerning Washington, D.C. based REITs, I erroneously gave the stock symbol of Corporate Office Properties Trust as COPT. It used to be listed under that symbol when it traded on the Nasdaq but it is now trading on the NYSE as OFC. I have updated and noted the correction in yesterday's blog. My sincere apologies for the error.

Tuesday, December 16, 2008

A Capitol Idea

I've been reading how people, especially young people, have been inspired by President-elect Obama to consider government service as a possible career. Combine this with substantially increased government oversight of the financial and automotive industries along with the proposed public works projects and what do you get? You get bigger government. A lot bigger. In the end, not only will we taxpayers be footing the bill for all of this but we'll also be paying the salaries of everyone hired to implement these programs. How we do this is up to Congress but I'd be willing to bet that some fairly hefty tax hikes will be involved, even for middle-income folks. (Here in California Gov. Schwartzenegger is proposing a sales tax increase that in Los Angeles County could come to 10.25%!)

This got me thinking as to how we, the taxpayers, can at least recoup some of the monies we'll be shelling out down the road. Let's see...tons of new jobs...in Washington, DC...people needing places to live, work, and shop...hmmm. Spelling it out like this, the answer is pretty obvious: Real-estate investment trusts (REITs) with a heavy emphasis in the D.C. area. Note that the D.C. conurbation is the nation's fifth largest metropolitan area and third largest office market after New York and Chicago. Its office market has traditionally been stable since the federal government is the major employer.

Real-estate cognoscenti are predicting that a turnaround in real-estate won't be seen for at least another six months to a year or perhaps even longer. But with the Fed today promising that it will do whatever it takes to inject liquidity into the credit and mortgage markets, now would be a good time to start taking a look around the REIT aisle and readying our shopping lists.

REIT categories
REITS, or real-estate investment trusts, are corporations that can be involved in many aspects of the real-estate market. As long as they pass on a significant portion of their income to investors (at least 90%), they are exempt from corporate taxation. REITs can operate in any or all of the following categories: industrial, office, retail, and residential. So here's my list of REITs that have a strong presence in our nation's capitol listed according to category.

Office REITs
Boston Properties (BXP): The company has three major projects under development in the D.C. area. It leases over 8 million square feet of Class A office space in the Boston, Manhattan, and D.C. areas with about half that (4 million sq. ft.) in San Francisco and 2 million sq. ft. in Princeton, NJ. Fundamentally, it is outperforming its peers but the balance sheet is showing some quarterly cash-flow issues possibly due to several recent acquisitions. The company issued 4Q guidance above analysts' estimates and is maintaining its current dividend. The dividend yield (D/Y) is 4.6%.

Corporate Office Properties Trust (OFC)*: This REIT focuses on strategic customer relationships and specialized tenant requirements in the government defense IT and data sectors. Its properties are typically concentrated in large office parks adjacent to government demand drivers and/or in growth corridors. It owns 253 office and data properties totaling 19.1 million square feet, most of which is concentrated in the D.C. area. (It has much smaller holdings in Colorado Springs, Princeton, and Philadelphia.) It prides itself on providing technically sophisticated buildings in visually appealing settings that are environmentally sensitive, sustainable and meet unique customer requirements (many of its buildings are LEEDS certified).
One potential problem I see with this company is that a Democratic-controlled Congress might well cut back on defense spending. (Congress is going to have to make some cuts somewhere to pay for all of Obama's proposed new programs.) The company has been steadily increasing dividends for the past eight years. Current D/Y is about 4.8%.

Brookfield Properties (BPO): The company owns, develops, and operates premier assets in the downtown cores of high-growth North American cities including New York, Boston, Washington, D.C., Los Angeles, Houston, Toronto, and Calgary. Its skyline-defining portfolio attracts major financial, energy and professional services corporations which have high credit ratings and maintain long-term leases. The company’s performance through the years is distinguished by strong, consistent financial results and a track record of steady growth. Currently, it owns 15 properties in the greater D.C. area. It's raised its annual dividend since 2001 and now is paying a D/Y of just over 8%.

Industrial REITs
First Potomac (FPO):
The company invests in light-industrial properties of at least 50,000 square feet in the D.C. area as well as the surrounding Mid-Atlantic states. It was recently upgraded based on the belief it can continue to obtain financing due to the small size of its assets, management competency, and the expected continuation of acquisitions via joint ventures. A price target of $10 was put on the stock which ended today up almost 11% to $7.65. The company has paid a steady dividend since 2004. Current D/Y is a hefty 17.8%.

Retail REITs
Washington REIT (WRE): Although this company is classified as a retail REIT, it has a diversified portfolio of 89 properties consisting of 14 retail centers, 25 office properties, 17 medical office properties, 23 industrial/flex properties, 10 multifamily properties all totaling 12.8 million square feet. This is a pure play in the D.C. area since all of its holdings are located here. The company lowered year-end guidance citing equity dilution and delay in proposed acquisitions. Fundamentally, the company's balance sheet isn't as strong as some of the REITs in the other categories, possibly due to the downturn in retail, but it still has managed to increase its annual dividend since 1992. Current D/Y is about 6.1%.

Saul Centers (BFS): The company's portfolio consists of 50 community and neighborhood shopping center and office properties totaling approximately 8.2 million square feet. Approximately 80 percent of cash flow is generated from properties in the metropolitan Washington, D.C./Baltimore area. Revenues and income have been steadily increasing, although there was a small drop in the 3Q numbers. Dividends have been increasing since 2005. Current D/Y is 3.9%. Technically, the stock today broke through major resistance—a bullish sign.

Residential REITs
Most of the residential REITs that I researched operate across the U.S., but I did find one that is concentrated in the northeast, including substantial holdings in the D.C. area.

Home Properties (HME): The company operates 125 communities totaling close to 35,000 apartment units in the Northeast, Mid-Atlantic, and Southeast Florida markets. In its third quarter report, the company CEO said that occupancy was at 95.1%, the highest level since 2000. Clearly, the recession hasn't caught up with this company yet. It has been steadily increasing dividends since 1994 inception. Current D/Y is 6.4%

Summary
I think that if there is an expansion in the D.C. area, the REITs that will benefit the most will be in the residential and office categories. Industrial properties could contract if Congress slashes defense spending, and unless consumers can be coaxed into opening their wallets, the retail markets could be lackluster as well. Some folks may object to the omission of Vornado (VNO) but I felt that even though it does have a significant commercial presence in D.C., it was just an average sized piece of its portfolio pie.

Technically, REITs have been taking a beating along with pretty much everything else, but today's Fed news could be just the spark needed to ignite the real-estate and financial sectors. REIT stocks zoomed up 10-20% today but is it time to buy? I think so as many of them took out major resistance. Even if the stocks do head back down, most of them are still trading 30-50% off their September values. Plus, they pay a nice dividend and none of the REITs mentioned here have reported a dividend cut--at least not yet.

The time may be right to add some REITs to your portfolio.

*Symbol correction (dated 12/17/08): This symbol was originally given as COPT. The company did trade under that symbol when it was listed on the Nasdaq. It now trades on the NYSE under the symbol OFC. My sincere apologies for the error.

Monday, December 15, 2008

Using the Parabolic SAR to determine exit points

In general, exiting a trade is probably tougher for most investors than entering one despite the fact that there are many ways of doing so, either technically or quantitatively. Quantitative approaches include fixed stops that will trigger once a profit percentage is reached or trailing stops that follow the price and are triggered once the price begins to move against the position by a designated percentage. Technical criteria include trend-line violations or a reversal in a technical indicators. One such indicator that is particularly useful in determining exit points is a called the parabolic SAR.

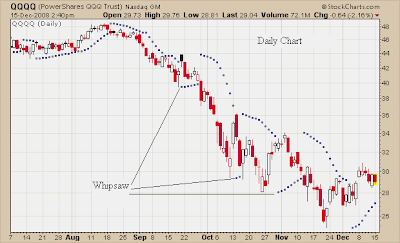
The parabolic SAR (short for Stop And Reverse) is a trend following indicator invented by J. Welles Wilder, Jr. a mechanical engineer who also created the RSI (Relative Strength Index) and the DMI (Directional Movement Indicator). It is based upon the theory that the path of a strong trend is shaped like the arc of a parabola. In up-trends, the indicator is displayed as a series of dots underneath the price bars; in down-trends, the dots are above the price bars. A “buy” position is entered when the indicator moves below the price, and a “sell” position is signaled when the indicator moves above the price. (See below charts.)

Once in a position, think of the dots as a type of trailing stop. From the charts below you can see that the dots are farther away from the price at the beginning of a move and tighten up as the trend continues. The position of the indicator is controlled by two variables: the step and the maximum step. If the step is set too high, the indicator will fluctuate more often and whipsawing will occur. The maximum step controls the adjustment of the indicator as the price moves. Lowering the maximum step furthers the indicator from the price. Wilder recommends setting the step at .02 and the maximum step at .20. Most charting services will allow the user to tweak these variables.


Potential problems
The parabolic SAR works great in trending markets but is miserable during periods of consolidation. One way to minimize this effect is to look at longer time periods—a weekly chart instead of a daily chart, for example. You can see from the charts of the Nasdaq 100 tracking stock, the QQQQ, that the parabolic SAR switched three times on the daily chart during brief consolidation periods that occurred from September to November, but this whipsawing is not evident in the weekly chart where the indicator has signaled a downturn since the beginning of September. This is not to say that using a longer time period is the way to go, either, for you do lose some accuracy when it comes to timing your entry and exit points.

So what's the solution? One way is to use other technical events like the breaking of a major support or resistance line or the breaking out of a base. Another way is to use other technical indicators for trend confirmation. Wilder himself estimated that trends occur only about 30% of the time and suggested using an oscillator such as his ADX (Average Directional Index) to determine the direction of the trend. Other indicators that can be used effectively are the CCI, the MACD, and moving average cross-overs.

Where to find the parabolic SAR
If your charting service doesn't carry the parabolic SAR, you can find it at Yahoo! Finance and StockCharts.com which has a whole boat-load of charting tools along with an in-depth description of each and how to use it. Have fun!

Thursday, December 11, 2008

How fundamental events affect stock price

Everyone knows that events are what feeds the market, but how do these events translate into price movement? Any market technician is able to look at the chart of an unspecified company and give a fairly accurate history of the events that shaped its price profile. I know because I've wowed my friends with it, and by learning just a few market moving basics, you'll be on your way to wowing your friends (and yourself), too.

Parlor tricks aside, the main reason you'll want to learn how to read a chart is to make you money, or at the very least, avoid losing it. In Recipe #5: News Nicoise, we list market moving events and identify ways to profit from them. Some events, however, affect price more than others. Here's a list of events that generally have the greatest impact: mergers, earnings guidance raised or lowered, credit rating raised or lowered, analyst rating raised or lowered, dividends increased or decreased, stock buy-backs, and sundry corporate events such as accounting irregularities or abrupt changes in high-level management. There are also industry-specific events. For example, the success or failure of a clinical trial has the potential to make or break a fledgling biotech.

Graphic examples of some market-moving events

A bearish example
One doesn't have to look very far in today's market to find stinky stock charts. I selected the chart of insurance giant Genworth Financial (GNW) because it illustrates several major events.


A. 11/6 (after market close): Reports huge third quarter loss. Withdraws full-year guidance. Suspends dividend and stock buy-back program. The stock gaps down 14% the next day, dropping another 34% at the close.

B. 11/10 (after market close): Moody's downgrades the company's debt rating. Next day, the stock gaps down 25%, closing the day off 40% from the open.

C. 12/8: Proposals aimed at freeing up insurers' capital are tentatively approved. This cheery news produced industry gains across the board. Genworth gapped up on the open, closing up 42% over the previous day's close.

This week, the stock has been in an uptrend and has closed the price gap triggered on November 11th. This is a short-term bullish move. Barring any other unforeseen bad news in the financial sector, we could reasonably expect the price to gain another $1.50 where it will have to fill the 11/7 gap at $4. I wouldn't advise conservative investors to jump in until the stock convincingly clears major resistance at $5.

Note that an “island reversal” was formed between the 11/11 exhaustion gap and the 12/8 breakaway gap. Island reversals don't necessarily signal a change in direction; they can signal the start of a consolidation process as well which is why I urge all but the speculative to wait until major resistance is toppled.

A biotech example
A couple of years ago, a web acquaintance of mine was touting Northfield Labs (NFLD) as the next biotech giant based on their sole product called Polyheme, a red-blood substitute, that was still in development. So convinced was he of this company's success that he not only convinced his relatives to heavily invest in it, he also TOOK OUT BIG LOANS (pardon my yelling) to buy more stock! Any reputable financial advisor would have had an apoplectic fit.

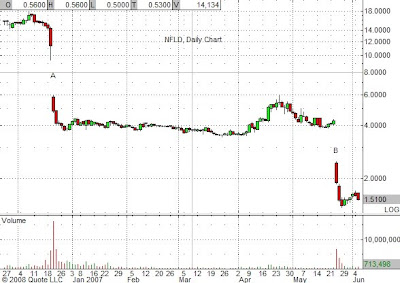
Okay, you all know what's coming here. Take a look at the company's price movement between the end of 2006 through the middle of 2007.


A. 12/20/06 (before the market opens): Preliminary results of a late-stage trial of PolyHeme show that it failed to meet the study's primary goals and was shown, in fact, to be inferior to a saline solution. This announcement whacked two/thirds off the stock price in one day.

B. 5/23/07: PolyHeme failed to show any significant efficacy in its Phase III clinical trial. The stock shed over 50% that day. Surprisingly, the company is still around but the stock is now trading around 50 cents, down almost 98% from its $23 high set at the beginning of 2005.

A takeover example
On November 24th (point A in the chart below), Johnson & Johnson (JNJ) announced that it would purchase Omrix Biopharmaceuticals (OMRI) for $25 per share in cash. The stock immediately jumped up 13% on the open and has been trading in a very tight range since. I'm including this chart so you'll know what a company that is being acquired looks like. Unless there's some significant short-term money to be made on the transaction (see Recipe #13: Post-Takeover Tacos*), investors should avoid these.


Summary
This is just the tip of the iceberg when it comes to technical analysis (TA). My purpose here was to show all of you scaredy-cat fundamentalists that TA is not Jamaican voodoo but more like the map of the mind of the investing collective. It's really not that tough, and once you've analyzed a half a million charts or so, you'll get the hang of it.

In the next day or so I'll be showing you how you can use a chart to quickly and accurately determine that slipperiest of fishes: the exit point to a trade.

A useful charting tool
Google Finance provides stock charts with news flags that are described in an adjacent scrolling menu. You can set up this feature as well as adding dividend flags and stock splits to your charts via the settings tab. Nifty, no?

*My MANDA (M & A) Portfolio is based on this recipe and Mario Gabelli's ABC Fund operates on similar principles.

Tuesday, December 9, 2008

Basic chartology: Linear vs Log scales & other useful tips

Several of my close friends in the investment field have recently admitted to me in whispered tones that they have suffered significant losses this year not only in their personal portfolios but their professionally managed ones as well. These are serious people who make stock selections based on fundamentals and hold on to them through thick and thin, provided the reasons that they bought them in the first place don't change. Whenever I happen to toss in a polite comment such as "Your favorite stock just broke major support and I strongly recommend dumping that stinker," I receive reactions that range from rolling eyes to actual nose scrunching, as if I just presented them with a plate of Limburger.

The financial field is divided into two camps, much like the Republicans and Democrats--the technicians who see the world as it is and the fundamentalists, like my friends, who insist on viewing the world through rose-colored glasses. In general, the fundamentalist camp lumps technical analysis in with voodoo and elven runes and therefore since they don't know anything about it, it must be evil. Frankly, we technicians don't give a damn what they think as long as they leave us alone.

But sometimes miracles do happen.

It's amazing how a contraction in one's financial security can change a person's point of view, for in fact, a couple of my friends have recently admitted that they wished they had understood the basics of technical analysis. I accept their hidden apologies and in the spirit of their recent enlightenment, today's article is dedicated to them and all other beginning chartologists.

Note: Seasoned technicians need not proceed any further.

What am I looking at?
Before one can even begin to dissect a stock chart, one needs to understand the difference between a linear and a logarithmic scale. On a linear scale, all whole numbers are equidistant from each other. In other words, the distance between, say, one and two is the same as the distance between one hundred and fifty-nine and one hundred and sixty. Simple, right?

A logarithmic, or log, scale is very different. Here, the numbers are not equally spaced distance-wise; rather, they are equally spaced percentage-wise. For example, the distance between 5 and 10 is the same as the distance between 10 and 20. What this means on a stock chart is that a price bar representing a 50% gain will be the same size no matter where it appears. In this case, a picture is probably worth a thousand words. Below are two charts of Excel Maritime, EXM—one linear and one log.


Comparing these two charts, you can see that the log scale puts an equal weight on each price bar making today's 42% move that much more dramatic. Most technicians prefer a log price scale for this very reason, but it's okay if a linear scale makes more sense to you. Just know the difference.

A few other technical tips
You might notice a few things from examining the above charts. For one, you can see that the price tends to “bunch up” at the decade intervals, i.e. 10, 20, 30, etc., and to a lesser extent, at the 5-levels, i.e. 5, 15, 25, etc. These are called support and resistance levels. For EXM, you can see that it spent a good month bouncing off the $10 level in October which became a level of support because it was, in fact, “supporting” the price.

You'll see this support was violated on November 11th followed by another down day. This was a strong indication that the buyers had thrown in the towel and the sellers were now in charge. The price plunged. Its recent $3.50 low could be the bottom as evidenced by two factors: 1. The past two days of strong price movement have been accompanied by much heavier than normal volume (not shown on the charts above), meaning that the shorts are probably covering and the bulls are regaining power; and 2. Today's price bar has filled the gap set on November 20th. Once a price gap is filled, chances are good that it will continue moving in the direction of the fill.

Notice that the previous $10 support level is now a resistance level. This is a psychological barrier for traders and will be the stock's next hurdle to upward progression. If it manages to break through it on heavy volume, further upside movement is highly probable.

Well, that's the long and the short of log and linear scales. I hope this mini-chartology lesson has whetted your appetite for further study into the beauty of technical analysis. Tomorrow, I'll continue our education with a few other interesting and useful chart-reading tips.

Note: All of the major web-based financial sites--MSN Money, Google, Yahoo!--offer both linear and log charts. MSN Money also offers a log base 2 scale, not that I'm sure how to use it.

Monday, December 8, 2008

Today's market surge: A head-fake or the beginning of a real turnaround?

Whether Congress's proposed temporary bailout of Detroit combined with Obama's stimulus plans to create jobs by repairing our aging infrastructure was the engine that fueled today's broad-based rally is immaterial to market technicians who, like me, are getting excited over the forming chart patterns. Not only are today's break-outs and bullish gaps displayed by many individual stocks (most notably the best-of-breed companies in the infrastructure and basic material sectors such as water transport, coal, construction, and steel as well as some tech stocks and electronic stock exchanges) but for me, the most exciting and possibly telling pattern could be forming in the the S&P 500 index itself.

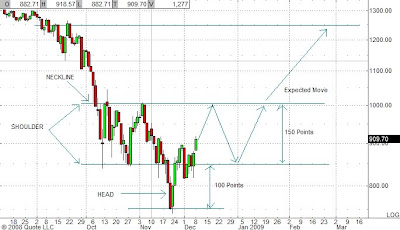
Below is a daily chart of the SPX. To me, it sure looks like it is in the process of forming an inverse head and shoulders pattern. For the chartologically challenged, a head and shoulders formation is a very powerful chart pattern that is coveted by many traders because it is so successful. (For a closer look at these patterns and some examples, see my March 5th and 6th blogs.) Let's look at this chart more closely.


You can see that the left shoulder was formed from the beginning of October to the beginning of November. The neckline, or the new level of overhead resistance, is at 1000. The top of the shoulder is at 850. The head was put in two weeks later and occurred at the 750 level, one hundred points below the shoulder. The last several trading sessions have touched the 850 level again and today's gap up is a strong indication that a right shoulder is beginning to form.

If this pattern is indeed in the formation process, what can we expect from here? As my arrows on the chart indicate, we should expect to see the SPX retest the neckline level at 1000 in the next week or so. The index will then reverse, and head back down to the 850 shoulder level probably some time in the beginning of January. If this level is successfully retested, then the only thing left to complete the pattern is for the S&P to rise back up again to the neckline. If it manages to break through that on heavy volume, we can easily expect it to rise at least another 250 points which is the magnitude of the distance between the neckline and the top of the head.

Of course, these are a lot of ifs. Trading mavericks can play each leg of this formation as it develops; for the gun-shy, I'd recommend waiting until the entire pattern is formed and then taking a bullish position if and only if the index decisively breaks through its neckline level which will most likely happen in the middle to the end of January.

If this pattern does play out as I've indicated, it would do a lot to boost the confidence and morale of the retail investor which, I believe, have been more badly beaten up than the market itself.

Thursday, December 4, 2008

Oops!

Apparently in my fever-induced haze yesterday, I misunderstood Cramer. I thought he was looking at potential takeover targets in the drug sector only but obviously that isn't the case given his picks today.

He proposed that Illinois Tool Works (ITW) acquire Manitowoc (MTW) (which, by the way, he mispronounces but I'll cut him some slack since he's not a Cheesehead) and Nike (NKE) for Under Armour (UA). Both look good to me, especially a Nike/Under Armour merger and am rather surprised it hasn't happened already. If you like it, too, and are looking for a cheap, conservative way to play it, I'd suggest the July 25/30 bull-call spread at a $2 debit. The maximum loss here is $2 (the debit amount) with a maximum gain of $3 (the difference between the strike prices less the debit).

Second guessing Cramer

Yesterday on CNBC's Fast Money show, it was noted that Big Pharma companies are sitting on piles of cash (read: billion$ and billion$) fueling speculation that M&A activity in the drug sector will probably happen and soon due to the depressed stock prices of many of the companies in the sector. Not only did Jim Cramer pick up this ball, but he ran with it in his show. He said that he was going to identify five companies that he feels are ripe for the picking. In a blatant attempt to boost his ratings, he only mentioned one candidate yesterday—Pfizer targeting Allergan—and will give his next two picks today and the other two tomorrow.

I decided that I would try to second guess Cramu (as he used to call himself in his newsletters years ago) and have come up with my own candidates. What I did was run a screen on the biotechs with EPS 5 year growth rate > 8%, average daily trading volume > 150,000, and market capitalization > $1B. Out of the top 25, I then hand-picked those that had positive cash flows and high sales per share. I whittled the list down to the seven listed in the chart below.


Of this seven, I looked at those that had robust drug pipelines as well as many drug collaborations. [Note: Genentech (DNA) is supposed to be in the process of being acquired by Roche but rumors are flying that Roche many not be able to come up with the money. If not, Genentech will be back on the block but with a market cap of $775B it's not going to be a cheap date.] I don't claim to be a specialist in the drug sector and can only make recommendations based on my short amount of research, but I do think the following are attractive take-over targets:

Biogen-Idec (BIIB): The company already has many drugs on the market and many in development, mostly in the areas of MS, non-Hodgkin's lymphoma, leukemia, and rheumatoid arthritis. It collaborates with many other biotech firms including PDL BioPharma, Elan, and Schering AG. Technically, the stock is down 50% from its all-time high put in a little over a year ago and is sitting on major support at $40.

Gilead Sciences (GILD): The company engages in the discovery, development, and commercialization of therapeutics for the treatment of life-threatening infectious diseases including hepatitis B, HIV, and the flu (you'll recognize Tamiflu). It has many research collaborations including Abbott and Novartis and commercial collaborations with GlaxoSmithKline and Bristol-Myers Squibb, to name a few. The stock price has survived better than others in this group, down only about 18% from recent highs so it might not be a
a great bargain especially considering its large market cap.

Genzyme (GENZ): The company develops and distributes treatments for renal, kidney, and thyroid diseases, osteoarthritis, and provides reproductive testing and genetic counseling among other services. The company has a collaboration agreement with PTC Therapeutics and a strategic alliance with Osiris Therapeutics. The stock has slumped 27% from recent highs and is threatening support at $60.

The rest of the companies in the above chart are not primarily involved in drug development (most of them make biotech supplies) and I must confess that I don't know enough about this space to make an educated guess as to who might want to acquire them.

Well, these are my candidates in the biotech area. Let's see if Cramu thinks so, too.

Wednesday, December 3, 2008

Under the weather

Dr. Kris is--achoo!--feeling a bit under the weather. She tried to put out a blog today but quickly chucked it for a nice warm bath. She's currently snuggled under a fluffy down comforter alternately sipping chamomile tea and dozing off to Turner Classic Movies.

She's hoping to return to her blogging duties as soon as possible.

Monday, December 1, 2008

Index & Currency Plays

It looks like today's market gobbled up the gains of the Thanksgiving rally. It was to be expected since the Monday following Black Friday is historically a down day. (See last Wednesday's blog, “The Turkey Effect,” for further details.) Last week's rally sparked hope of a market bottom; I, however, do not share that hope as evidenced by the following charts of the the VIX and the S&P 500.

What the charts are saying and how we can profit from them

The volatility index, the VIX
The chart of the VIX, the market volatility index, shows that it's been trading in a horizontal range for the past two months. The lower support level is around 55 (you could argue the case for support around 47 as well). Upper resistance is defined by the 80 level. A bottoming tail formed on Friday and today's gap up further emphasized this turn-around in direction. (Remember that the VIX and the markets move counter to each other.) So, is there any way one can profit from this channeling behavior?


Well, you can't actually buy the VIX but there are options on it with good liquidity at many strike prices. One conservative options play is to sell bull-put credit spreads on a day like today when the VIX is bouncing off lower resistance. Try the December 55/50 put spread (sell the 55 strike and buy the 50 strike) or the December 50/45 spread if you're of a more conservative bent.

This is a directional play and as such you don't want to wait for the price to move against you so I'd recommend closing out the spread when the VIX gets near upper resistance at 80. When it shows signs of heading back down, I'd reverse the process by selling an at-the-money (ATM) or slightly out-of-the-money (OTM) bear-call credit spread.

Nothing channels forever, so you may only get to do this a couple of times, but it could be worth your while. If the trade does happen to move against you, close it out or roll down the strike prices. I'd recommend setting your stop-loss at the break-even (B/E) price. For a bull-put credit spread, the B/E is the lower strike price less the net credit; on the bear-call side, the B/E is the price of the higher strike plus the net credit.

The major market indexes
The chart below shows the daily price action of the S&P 500. (I chose the S&P because it's the benchmark index for most comparison purposes but all of the other major indexes look similar.) You can see that it's found a new trading range bounded by a downwards sloping channel. For reference, I also included the 30 day exponential moving average as it seems to coincide with the upper price channel boundary.


We can play this in several ways using equities and options. (This channel is also a handy reference for index futures traders, too.) First, there's the tracking stocks—the SPY, DIA, QQQQ, etc. along with their double and triple long/short ETF counterparts. You can buy these when the index turns up from its lower channel boundary, sell when it reaches the upper boundary, and then take a short position (by either shorting the tracking stock or buying the short equivalent) when the index begins to head back down.

Options players can play the options on either the indexes or the tracking stocks. Options on the latter are cheaper and generally more liquid than the former. Possible options strategies include the above-mentioned credit-spreads, debit-spreads, or straight calls and puts. Because of the time decay factor inherent in options pricing, I prefer buying options with strikes that are at least 6 months out if I plan on holding them for more than a day or two.

A note on currencies

The Greenback
The long US dollar tracking stock, the UUP, has been trading in the $26-$27 range for the past six weeks. A definitive break on either side will likely continue in the same direction—just a heads up to you currency traders out there. (There are no options on the UUP, alas.)


The Yen
The Japanese yen is the only currency (with a tracking stock) that is bucking the buck. It's tracking stock, the FXY, has been rising steadily since its October 6th breakout and is less than $2 away from hitting its yearly high at $108.79. This tracking stock is optionable and selling the December 105 cash-secured put when it next takes a breather (maybe as soon as tomorrow) would be a nice way to ease into a long position. Note that many of its options are thinly traded and you can't buy any further into the future than June 2009.

Wednesday, November 26, 2008

The Turkey Effect

The Turkey, or Thanksgiving, Effect is a well-documented stock market phenomenon whereby the market is unusually bullish both the day before and the day after Thanksgiving. Nobody is certain why. Maybe people are overly-optimistic because they're in a holiday mood or perhaps the big dogs on Wall Street split early and leave trading in junior hands.

Historical evidence
I don't know the reason, but what I do know is that it certainly is no coincidence. According to a CXO Advisory Group web article, the day just before Thanksgiving (T-1) and the day after Thanksgiving (T+1) posted significantly higher returns. Return data collected from 1950-2006 showed T-1 days averaging about 0.37% and T+1 days averaging around 0.39%. These numbers look small but they're roughly ten times the average daily return during that period!

Since 1990, however, the returns have been smaller: about 0.19% for T-1 and 0.22% for T+1 with the standard deviation of T+1 being the smaller of the two and within reasonable limits. What makes the T+1 returns even more remarkable is that it is a half-day session. (US equity markets close at 1pm ET.)

We need to look no further than today's market action for confirmation of the Turkey Effect. The S&P 500 was up 3.5%, and I don't think it's unreasonable to expect a similar day on Friday. So, how can we best profit from it?

If you don't trade index futures, try options
You can play the index tracking stocks, such as QQQQ (Nasdaq 100), SPY (S&P 500), or DIA (Dow Industrials) but to get the most bang for your buck, I recommend the December at-the-money (ATM) calls. The options fields for all of these tracking stocks are generally much more liquid (and cheaper) than their index options. The chart below shows today's returns on candidate options.


The way to play these on Friday is to buy 10-15 minutes after the open (often the market slumps right after the open) and sell right before the close. You can place limit orders but make sure you're out of your positions before the close as you don't want to get stuck holding them over the weekend. (If nobody's biting at your limit order, change it to a market order.)

If the market does the unthinkable and reverse direction, don't get burned. Options need a bit more "wiggle" room than stocks, so I'd recommend placing a sell order if it drops below 20% of the purchase price.

Stock versus options returns
Today, the Q's gained 4.2%, the SPY gained 3.9%, and the DIA was up 2.8%. If instead you had bought the options, your return would have been magnified more than ten times!

Summary
So, instead of charging off to the mall Black Friday morn, stay home and buy some index options. You only have to wait three and half hours to pick up your paycheck. The stores will still be there and hopefully you'll have a lot more money in your pocket to buy that flat-screen TV and spread some holiday cheer.

Happy Thanksgiving!

Note: Do not trade options if you've never done so!

Tuesday, November 25, 2008

This 'n' that

Because this is a holiday week and Dr. Kris is in a holiday mood (translation: I'm just plain tired!), the remaining blogs will either be mercifully short or non-existent. We both get time off—yay! But just to keep everyone in the loop, here's a couple of quick things I want to pass along.

Currency currents
The currency markets are staging a reversal. The rally in the US dollar could be near its end as the chart of the UUP, the long dollar ETF, looks to be rolling over and is threatening to break through strong support at $26. If it does, you can either short it or buy its short ETF counterpart, the UDN.

Pressure on the dollar is good news for foreign currencies which could be starting a new bull run. All of foreign currency ETFs are up today, some of which are pushing against overhead resistance. The Euro and the British Pound Sterling are the most compelling, chart-wise. The Euro, especially, looks like it's going to break out any minute now. (The FXE is the Euro ETF; the FXB is the Pound Sterling ETF.)

MANDA Watch
Today, Swiss drug giant Roche announced that it will be acquiring Memory Pharmaceuticals (MEMY) in a $50 million cash deal in a move to bulk up its pipeline of schizophrenia and Alzheimer's drugs. This translates into 61 cents per share which is more than triple yesterday's closing price. The stock is currently trading at 57 cents and if I can snag it for a penny or two less, I'll add to the MANDA portfolio.

Dr. Kris on SeekingAlpha
Dr. Kris is now a contributor on SeekingAlpha, a compilation of daily financial blogs that address the markets and investing. It's a great place to get opinions inside and outside of the financial mainstream along with investing tips and trading ideas. A lot of my blog research winds up there which is how I stumbled upon it in the first place. You can leave your comments on any of the articles, but please don't leave me too many as I still haven't had a chance to comment on mine--argh! (Maybe when the turkey is cooking on Thursday...)

Speaking of Thanksgiving, if I don't get a chance to post by then, have an excellent holiday. Don't forget the Alka-Seltzer!

Monday, November 24, 2008

Pipin' hot: Water infrastructure plays

President-elect Obama wants to stimulate the economy by going the FDR/WPA route of creating two million jobs to fix America's aging roads and highways. He may want to add the country's crumbling water system to his infrastructure To-Do list.

An article addressing just this point was published in this weekend's Parade Magazine. Entitled “Our Crumbling Water Pipes”, the article cited recent major water main breaks in cities around the country spilling millions of gallons of drinking water in the process. The EPA estimates that fixing our aging pipelines will run in the neighborhood of $277 billion; not replacing it will it will cost even more due to the loss in potable water caused by underground leakage. In Western states especially, water is becoming an increasingly valuable commodity and any attempts to contain excess waste will be strongly encouraged.

So, how can we play this situation?

We can look at water pipe manufacturers, pipe maintenance and repair companies, and heavy-duty construction contractors. But the stocks I really like and are the purest plays are those involved in what is known as trenchless replacement technology. What this means is that instead of digging up the old, corroded pipe, you dig a hole at either end and literally “pull-through” a new pipe. How cool is that? There's also a similar technology called trenchless pipe rehabilitation that will automatically repair a leaky pipe in a similiar manner. Trenchless technology seems like the least expensive and quickest way to repair and replace our aging water pipe infrastructure, saving a lot of construction time and materials over conventional methods.

Pipe Manufacturers
Of course, that doesn't mean that trenchless technology will put the steel and concrete pipe makers out of business. Trenchless technology only addresses existing pipelines and we will always need new ones. Here's a couple of companies that have direct involvement in water pipe manufacturing.
Northwest Pipe (NWPX): Manufactures high-pressure steel pipeline systems for use in water infrastructure applications, primarily related to drinking water systems.
Ameron (AMN): Manufactures concrete and steel products for several infrastructure applications. Its Water Transmission Group manufactures and supplies concrete and steel pressure pipe, concrete non-pressure pipe, and protective linings for pipe and fabricated steel products. This is the only company mentioned here that pays a dividend (3.2% current yield).

Trenchless Pipe Technology companies
These are the direct plays on infrastructure repair and replacement. I prefer Insituform because it's the purest one of the two.
Insituform Technologies (INSU). The company is a worldwide provider of technologies and services for rehabilitating sewer, water and other underground piping systems without digging or disruption. The company operates in two segments. The rehabilitation segment provides trenchless methods of rehabilitating sewers, pipelines and other conduits using a variety of technologies including their cured-in-place pipe process. The Tite Liner segment provides a method of lining new and existing pipe with a corrosion and abrasion resistant polyethylene pipe. Most of the company’s installation operations are project-oriented contracts for municipal entities.

Layne Christensen (LAYN). This global company provides drilling and construction services and related products to the water infrastructure and mineral exploration markets as well as producing unconventional natural gas for the energy market. In the water market, the company's pipeline business is handled by recently acquired Reynolds, Inc., and its pipe renewal and rehabilitation services are conducted through its Inliner Technologies Division. Today, an analyst at DA Davidson upgraded the company from Underperform to Neutral.

Note: There are other companies that also provide trenchless services but they are all privately held.

Water-pipe contractors
Sterling Construction (STRL).
Sterling is a heavy civil construction company that specializes in the building, reconstruction and repair of transportation and water infrastructure. Transportation infrastructure projects include highways, roads, bridges and light rail. Water infrastructure projects include water, wastewater and storm drainage systems. The company's operations are focused mostly in the Southwest.

How to play them
Many of these companies have lost over half their market value in the past several months. Although they all experienced a nice boost today and some look like they might be putting in a double bottom, I would be a cautious buyer here. I think today's market rally is just a pre-Thanksgiving head-fake, so be careful! Add the ones you like to your long-term portfolio watchlist and if you really want to own some, start buying in dribs and drabs.

Friday, November 21, 2008

Is gold regaining its luster?

Yesterday on CNBC's Fast Money show, guest investor Peter Schiff* was on with his current market predictions. Two years ago, he was dead on when he said that we were in a huge credit bubble which would be followed by a financial crisis and a “major, major recession.”

Hello! Very few listened to him then, and although nobody's right all of the time, I thought that it might behoove me to listen to him now. So, what are his current recommendations? He says to get out of the dollar 'cause it's going to “fall like a stone”, buy the dips in commodities, and start investing in international equities. He also predicted gold is going to go through the roof in the next couple of years, possibly hitting the $2000 an ounce mark. Yikes!

Well, investors today seemed to catch the gold bug causing a spike in the otherwise severely depressed sector with some mining stocks advancing over 40% over yesterday's close! Technically, gold seems like it could be putting in a bottom, even if that bottom is only temporary. Mr. Schiff thinks that could drop to $600 before ultimately turning around and heck, who am I to argue? Judging from the chart of the GLD--a gold ETF that tracks the price of gold bullion and is the purest gold play out there--the $70, $65, and $60 all form major support levels (the GLD trades at roughly 1/10th the price of gold).

Even if the yellow metal does drop a little more, now isn't a bad time to start getting hoarding a few American Buffaloes. The question is, how should we play it?

Gold ETF plays
There are two publicly traded gold ETFs—the GLD and the IAU. They are identical in nearly every respect except for two: the GLD is much more heavily traded (average daily volume is 18 million shares compared with 800,000 on the IAU) and the GLD has options. If you're an options player, the play I like here (especially since we may not be completely confident where it's heading in the short-term) is to sell cash-secured December puts at the $65 or $70 levels. (See Recipe #6: Put Pot Pie for further info on implementing this strategy.) The premium you take in will reduce your overall cost basis and automatically give you a downside cushion.

When gold finally does put in a convincing bottom, then buying the January 2011 LEAPS would be appropriate. The beauty of this approach is that you can write monthly covered calls against it to reduce your cost basis.

There's also a double-long gold ETF, the DGP, that tracks twice the price of gold (divided by 50). It's trading at $15.40, is very liquid and non-optionable--another choice if you're very bullish on the sector. Just remember that not only are the rewards doubled, but so are the risks.

Gold stock plays
If playing options are just not you, then here are some recommendations on gold mining and exploration stocks. My selection criteria is based on technical factors (chartology), average trading volume (liquidity), and analyst recommendations of “Hold” or better. One plus that the mining stocks have over the GLD is that many of them pay dividends, albeit small ones. Most of these companies are well-established in the areas of exploration, mining, and production. The only speculative addition is Tanzanian Royalty (TRE) which is an exploration-only company. I included it because Tanzania is mineral-rich, the stock is relatively inexpensive, and I like the stock's recent upward chart action.


You can play any of the optionable stocks the same way as the GLD using cash-secured puts or call LEAPS. If you want to buy the stock (and get the dividend), I'd suggest the fractional approach—buy a quarter position now, another quarter in a few weeks, etc.

Summary
Remember that gold is predominantly used as a hedge against inflation which I don't think we'll have to worry about for a while. But, if credit remains tight, the world stops investing in US Treasuries, and the dollar tanks, people could be turning to gold as one of the few remaining safe havens. In that case, $2000 an ounce isn't that unthinkable...unless someone comes up with a cost-efficient way to manufacture it. Mr. Fusion, anyone?

*Click on this link to see the Fast Money interview with Peter Schiff.

Thursday, November 20, 2008

MANDA Holdings as of 11/20/08

Update includes the new listing SM&A (symbol: WINS).


Click on image for larger view.

Market Levels & Another MANDA Addition

Index support levels
Well, it looks like the VIX is continuing its uphill march closing over 80 today, up almost 9%. As the VIX shoots up, so plummets the market. Major market averages closed down 5-7%. The only intelligent thing I can say from looking at their charts is that from a bullish standpoint they all completely suck...and it appears that they are going continue to suck. ("Suck" is the financial technical term for really really really awful.)

So, what are the next support levels?

Unfortunately, pretty far away. In fact, I can't even give you a number on the Dow Industrials and the OEX (S&P 100) because they've both surpassed their ten year support levels and I don't have data going back any further. The good news is that I can give you support levels for the other indices:

S&P 500 ($752): Minor support is at 670. The next major support level is at—no, you don't want to know. (Okay, it's at 470.)

Nasdaq ($1316): The Nazzie is right on major support. Next stop is 1175, but I do think we could see it brush 1000. Remember Nasdaq 5000?

Dow Transports ($299): Minor support levels are 285, 250, and 215-220. Next major support is 200. Let's hope it doesn't come to that.

What does this all mean?
It means that you should be out of all your losing long positions and either be in cash or in short positions. (See previous blogs for shorting ideas.)

Another MANDA Addition
I don't know how I missed this one, but SM&A (WINS) is a management services company that provides business capture and proposal development services along with post-award risk management and profit maximizing to the homeland security, aerospace, information technology, and engineering industries.

On October 31st, the company announced a proposed merger agreement with Odyssey Investment Partners, a privately held middle market private equity firm. Terms of the all-cash deal is $119M which translates into $6.25 per SM&A share.

According to the company press release, management is delighted at the offer which is subject to the usual anti-trust regulatory issues and shareholder approval. It also may solicit other takeover offers during the first 45 days. The deal is being financed by Caltius Mezzanine and this is the only thing that really bothers me about this deal. Caltius finances deals in the $5-$75M range so I'm wondering where the extra dough is coming from...?

BUT...the stock has held up pretty well considering the market climate and I don't think that Odyssey would be dumb enough to make such an offer if it knew it couldn't raise the cash. The deal is expected to close late this year or early next year.

The stock is going into the MANDA portfolio today at a price of $5.61. This gives a yield of around 11.4% on the trade.

Disclosure: I'm going to purchase the stock in my own portfolio if it trades at or below $5.55.

Wednesday, November 19, 2008

Loading up on lemons

I said yesterday that if the market declined today that I would identify candidates for shorting strategies among the major indices. I have to laugh at myself because it's almost like shooting fish in a barrel since almost every stock out there is deteriorating. But I need some content, and this is the best I can do at the moment. (I need a vacation!)

Lemon selection
My basket of lemons are selected from the top 25 holdings of the Russell 2000 (mostly healthcare, utility, and technology stocks), the NASDAQ composite (mostly tech and biotech), and the S&P 500 (mostly large tech companies and conglomerates). My selection criteria was based on technical analysis only; fundamental analysis is left to you, dear reader. (Hey, I can't do everything!)

The worst of the Russell 2000
Two of the three lemons that I found not surprisingly came from the badly beaten down commercial real estate industry. Both Realty Income (O) and Senior Housing Prop. Trust (SNH) have recently broken major support. Realty Income is currently trading around $16 and has its next minor support level at $14.50. SNH is trading at $12 and is shortable down to the $10 level where it, too, has minor support. Both of these stocks pay a decent dividend which you don't get if you're short the stock, alas.

Wabtec (WAB) is a railroad that's currently priced just below $31. It recently broke major support and is chugging downward to test $26 support.

The worst of the NASDAQ
Apart from the financial CME Group (CME), the rest of the dogs are all well-known members of the tech sector. And speaking of the financial and technology sectors, the financial spyder (XLF) along with the semiconductor holder (SMH) are at historic lows which means we're definitely in good lemon-picking country. (Their monthly charts are below.) All of the following have broken major support except for Google and Qualcomm which are sitting right on it (and I expect that their support will not hold):

Applied Materials (AMAT): Current price = $8.42. Next support around $6.50.
CME Group (CME): Current price = $170.88. Next support around $144.
Cisco (CSCO): Current price = $15.08. Next support around $13.
Intel (INTC): Current price = $12.49. Next support around $9.
Amazon (AMZN): Current price = $35.84. Next support around $32.
Google (GOOG): Current price = $280. Next support around $220.
Qualcomm (QCOM): Current price = $30.01. Next support around $27.

The worst of the S&P 500
My top six picks from this index include Cisco, Intel, and Google mentioned above as well as General Electric (GE), Bank of America (BAC), and Citigroup (C ). These last three are trading at twelve to fifteen year lows and they've all broken major support levels. Where they eventually land is anyone's guess, but I'd aim for the $10 level on GE and B of A ($3-$4 moves), and $3 or even less on Citi (a $3+ move).

More lemons: The bailout banks
You would think that the stock of the banks that got bailed out by the government would be doing okay, wouldn't you? Uh-uh. Prices on all of them have fallen off a cliff; Goldman Sachs and Morgan Stanley are trading at their lowest point EVER with none of them show any signs of forming a bottom. Here's the list for your shorting pleasure: Goldman Sachs (GS), Morgan Stanley (MS), Merrill Lynch (MER), JP Morgan (JPM), Bank of New York Mellon (BK), State Street Corp. (STT), Wells Fargo (WFC), and two from above Bank of America (BAC) and Citigroup (C ).

Summary
This list should give you enough lemons to make a huge pitcher of lemonade which will hopefully put some profit in your pocket. If you do put on some shorts, remember to keep a daily watch on the VIX. When you see a spike, that's your cue to exit. The tricky thing about short positions is that the price can quickly move against you so you need to keep on your toes. Shorting is not for the faint of heart or weak of stomach!


Tuesday, November 18, 2008

Lemons to Lemonade: How to profit from the next downturn

Well folks, the volatility index, the VIX, finally broke through major resistance at 70 today. Most of the major market indices followed in the opposite direction by breaking through major support levels. The most notable hold-outs were the Dow Industrials, the NYSE Composite, and the Dow Transports. This last one could be a glimmer of sunshine in an otherwise stormy sky because the Transport Index typically (but not always) is a leading indicator of market direction.

I began pulling together today's blog before the big rally hit just before the close. Although the VIX closed below 70, I do believe that we're not out of the woods just yet. For those of you who are firmly attached to your rose-colored glasses, hope and pray these support levels will hold. For those of you who feel that the credit crisis has yet to play out completely, you may want to put on some short-term bearish positions. Here are some ideas...

The VIX and what it's signaling
The chart of the VIX shows major resistance at 70 which it just broke today. I've said it before and I'll say it again, but I think it could well go to 100. Well, at least 80 which is the next level of resistance.


My prediction is that the market will be heading down at least in the short term. So, assuming one has a few shekels left to trade with, how can we profit from this?

Profiting from a continuing bear market
There's many ways to profit from a continuation in the bear market. I've touched on some of these schemes in earlier blogs while one will be new. Before we go into them, we need to look find which markets have the greatest downside potential.

Index dogs
Technically, the Russell 2000 (RUT.X) and the Nasdaq composite (NASDAQ.X) are the worst of breed followed by the S&P Midcap 400 (MID.X), the Russell 1000 (RUI.X) and the S&P 500 (SPX.X) Let's take a look at potential ways to play them.

Buy index put options. It could take the VIX several weeks (or longer) to reach its maximum value, so you'll need to buy at least the January puts. But because of the accelerating time decay, I'd advise buying short-term options. In fact, my June 18th blog showed that the most profitable option plays were the January 2010 LEAPs. (A LEAP is an acronym for a long-term option.)

Buy put options on the corresponding index ETFs. The options will probably be cheaper but check on liquidity and bid/ask spreads. And don't trade options if you don't know anything about them. Here are the index ETFs:

IWM: Russell 2000. Liquid stock and options.
ONEQ: Nasdaq composite. This tracking stock isn't nearly as liquid as...
QQQQ: Nasdaq 100 tracking stock. Highly liquid stock and options.
IWB: Russell 1000. Liquid stock; thinly traded options.
SPY: S&P 500. Liquid stock and options.
UVM: Ultralong Russell 2000. (2x the Russell 2000). Liquid stock; fairly liquid options.
UVG: Ultralong Russell 1000. Stock thinly traded. No options.
BGU: A new family of funds that are 3 times the Russell 1000 index. (Ultralong and ultrashort funds are 2x.) Since this is a brand new fund, the options are highly illiquid and I would avoid them. (See the short version, the BGZ, below.)

Short the index ETF. Instead of buying puts, short the tracking stock. Don't forget to set your stop-losses!

Go long the short/ultrashort ETF and/or buy calls. Here are the short and ultrashort equivalents.
RWM: Short Russell 2000. No options.
TWM: Ultrashort Russell 2000. Liquid stock; fairly liquid options.
PSQ: Short QQQQ. No options.
QID: Ultrashort QQQQ. Fairly liquid options.
SFK: Russell 1000 Growth. Thinly traded stock; no options.
SJF: Russell 1000 Value. Thinly traded stock; no options.
SH: Short S&P 500. Thinly traded options.
SDS: Ultrashort S&P 500. Liquid stock and options.
BGZ: 3x short the Russell 1000. Liquid stock; very thinly traded options.

Note: All of the above strategies were summarized on a performance basis in the June 18th blog ETF or Options?

Another strategy
If you're more comfortable playing individual stocks, try going into the index and finding which stocks have been the worst performers. No, this doesn't mean you have to go through every stock in the Russell 2000, but looking at the top 20 or so will be enough. (Click on this link for Morningstar's list of the top 25 holdings in the Russell 2000.)

The Morningstar list gives the year-to-date returns for each holding, and I'd focus on the ones that are the biggest losers. Look at the fundamentals of the company and how they are performing relative to their sectors. Look, too, at the relative performance of the entire sector. Is it still in a downtrend? Has it broken major support?

Now apply the same criteria to the stock and if you have a real dog, then by all means short it or use a bearish options strategy.

When to exit
Exiting short positions is one of the holy grails of investing. Everybody has their own opinion and I'll toss in mine. Exit your short positions when the VIX has reached at least the 80 mark and shows a large topping tail. That's your cue to get out. If you're really adventurous, you could then start entering long positions.

If the VIX heads back over 70 tomorrow, I'll try to identify the worst of breed stocks on the above indices.

Friday, November 14, 2008

MLPs: Non-Oil & Gas Recommendations

Today we'll be finishing off the MLP miniseries by taking a quick look at some limited partnerships outside of the oil and gas industries as well as two MLP-focused funds.

Coal MLPs
You might just want to take a gander at these since coal could be an integral part of President-elect Obama's energy policy. They're all trading at or very near their all-time lows so now could be a good time to begin adding one or two to your growth and income portfolio.

Alliance Res Partners (ARLP) & Alliance Holdings (AHGP). Alliance Holdings is the general partner component of Alliance Res.* (Please see explanatory note below.) Although earnings were off by 25% in the last quarter, analysts expect huge growth in 2009. The company has steadily increased earnings since mid-2006 inception.

Natural Resource Partners (NRP). The company reported record Q-3 revenues and increased distributable cash flow by 59%. It's steadily increased distributions since 2002 inception.

Penn VA Resources Partners (PVR). Despite a decrease in third quarter earnings due to cash-payments to settle derivative contracts and higher interest expenses, the company CEO, James Dearlove, keeps an optimistic outlook: “At of the end of the third quarter, we had approximately $140 million of unused borrowing capacity under our $700 million revolving credit facility, which we believe provides adequate cushion to support our working capital needs and some modest growth opportunities. We are also confident that the fundamental characteristics of our business segments remain strong.”

Perhaps this is why this company has a higher distribution yield than the other two.

Fun & Done MLPs
There's two other MLPs that I'd like to cover. One wants to make sure that you have a good time and the other steps in when your time is up.

Cedar Fair (FUN). (You gotta love the ticker symbol.) This limited partnership owns and operates amusement parks, water parks, and five hotels mostly in the Midwest and the Mid-Atlantic. Probably its most famous holding is Knott's Berry Farm in Southern California. If you think that amusement parks have been suffering due to the recession, you'd be wrong. Revenues across the board have been up so far this year and Halloween sparked better than expected park attendance. Even if the economy worsens, the parks are closed until spring and by that time, the recession may have thawed. The major downside is debt, and the company has a lot of that. Paying down some of it might require the company to reach into its unitholders' pockets and reduce some of that juicy 14% yield.

This is a riskier play, but it could eventually pay off handsomely.

StoneMor Partners (STON). This grab 'em/slab 'em company owns and operates 223 cemeteries mostly in the eastern part of the country. There isn't much news to go on, but I did find that revenues are increasing along with the distribution payout which has increased steadily (although not as dramatically as some of the other MLPs) since it began in 2005. Revenue growth for the next five years is estimated in excess of 10%, not surprising considering the aging of the Baby Boomer generation. (Arg!)

Owning a piece of a plug isn't the sexiest portfolio holding but it could be a very lucrative one in the long run. The bonus is that a passing cemetery will put a smile on your face instead of a frown, and when was the last time that happened?

MLP Funds
I was able to find two funds that engage in MLP investing. One good reason to opt for one of these instead of making your own MLP basket is for tax reasons. With the fund, you'll get all of your necessary tax info in one form, and that could be a very, very good thing.

Bear Stearn Alerian (BSR). This is an exchange-traded note as opposed to a fund. What's the difference? ETNs are subject to the credit risk of the issuing bank. If that doesn't bother you, then check out this fund which tracks the Alerian MLP Index. (I betcha didn't know there was an index that tracked MLPs.) What bothers me about BSR is that it's only been around for a little over a year and it failed to make its September quarterly distribution. I'd really check into this one before buying.

Energy Income & Growth Fund (FEN). The fund has recently changed management but that hasn't help the share price which has dropped almost 30% in the past ten days. Its top holdings include Magellan Midstream, Energy Transfer Partners, Kinder Morgan, Enterprise Product Partners, Plains All American, Crosstex Energy, Enbridge Energy, Nustar Energy, and Holly Energy—many of which were on my list of recommended picks yesterday.

Note that the trading volume on both of these funds is low. If you like the ETN, you can buy it at this level or lower if you can get it. I'd be patient, though, in picking up FEN which is not showing any signs of price support. If you can snatch it around $12 or less, you'll be getting a yummy deal.

Conclusion
I hope you've seen some of the excellent advantages of adding MLPs to a long-term investment portfolio along with the disadvantages (mostly tax-wise) and potential risks running along the commodity supply-and-demand and short-term credit lines. I do think that despite these negatives, MLPs are a good value especially at these deflated prices, and I hope you think so, too.

Have a good weekend! Due your do diligence...or something like that.

*Note that many energy-related MLPs are structured where the partnership entity, that is, the company component that actually provides the services, is separated from the general or managing partner. Many MLPs offer both components as separate entities, each with their own ticker symbol. You can invest in either one but I prefer the partnership component because it pays a higher dividend. But if you're cowed by the concommitant tax complications, consider swapping the higher dividend for the tax simplification offered by the general partner. (Consult your tax advisor for further details.)

Thursday, November 13, 2008

MLPs: Current Recommendations

Today's market action indicates that we may be putting in a bottom, but whether this is THE BOTTOM or just a relative bottom remains to be seen. Personally, I don't think we've hit the bottom bottom as I feel we need to see the VIX rise a lot more (to 100?) before I'll be reassured that the worst is over. I still think hedge fund redemptions will continue until the end of the year. Why? Because investors will most likely want to take their tax losses in this year.* But in case I'm wrong and the indices are able to stay perched above current support levels, you need to have your list ready pronto so that you can lock in these low prices.

My blog for the past couple of weeks has been focused on income generating securities such as high dividend paying stocks and master limited partnerships (MLPs). Yesterday, we found that although MLPs trade exactly like stocks, they are structured differently as limited partnerships and not as corporations. This type of structuring avoids corporate taxation which is great on one hand because it allows a larger distribution (dividend) to be passed through to the unitholder (shareholder). On the other hand, the unitholder is ultimately responsible for the taxes which can become a complicated task at tax time.

Despite the tax complications, MLPs can be great additions to an investment portfolio (be careful of putting these in an IRA), especially if you have a long investment horizon. Today, we'll be sleuthing the space in search of beaten-down bargains.

My MLPs
There are a few important things to look for in an MLP. You want to find a company that is expanding operations, has enough cash on its balance sheet to pay dividends, and has a steady history of increasing dividends. I ran a screen through the MSN MoneyCentral stock screener using current dividend yield > 5, 5-year dividend growth > 5, average daily volume > 50,000 (to avoid liquidity issues), and with an analyst mean recommendation >= Hold (we don't want any perceived dogs). Here are the results (see the table at the bottom for a summary of current prices and distribution yields):

Oil & Gas Pipelines
Genesis Energy (GEL). The company beat recent third quarter estimates by 25%, earning 25 cents per share instead of the anticipated 20 cents. The company's CEO, Grant Sims, says that the company has more than enough cash to pay out distributions, with a cash/distribution payout ratio of 1.7 (that's pretty good). Further reassuring unit holders, he goes on to say that “the underlying cash flows from our businesses are not materially impacted by commodity prices and demand for our services appears to be steady. Genesis is fortunate to have approximately $170 million in available cash and debt commitments. This financial flexibility and high coverage of our distributions will be more than adequate to fund the internal accretive capital projects planned for the coming year and give us the ability to be opportunistic to hopefully continue to build long-term value for our unitholders.”

The stock hit a low of $8 on October 10th (the day of the grand market low) and is now trading at $9.42. If you like this one, now would be a good time to begin locking in that juicy 13% distribution yield.

Sunoco Logistics Partners (SXL). Despite losing revenue due to hurricane disruptions, the company is still increasing its distribution. It's also making new acquisitions and sports a fairly solid balance sheet. President and CEO Deborah Fretz is upbeat about the company's future: “Despite the turmoil in the credit markets, our business model remains solid and transparent and our strong financial position supports future growth. We announced a cash distribution of $0.965, a 3.2% increase versus last quarter and a 13.5% increase versus the third quarter 2007. It is the twenty-first distribution increase in the last twenty-two quarters. As announced last quarter, we expect to increase our 2009 distribution by at least 10% and we reaffirm this guidance given the investment opportunities we have underway."

Sunoco is currently trading around $43, and I'd grab some of this before it rises any further.

Magellan Midstream Partners (MMP). The company has healthy expansion prospects which are being funded by a $550M revolving line of credit with 18 banks, of which it has only used $15M. "We faced several challenges during the quarter, but our positive results show that our commodity-related activities continued to serve as a natural hedge against the negative impact of high refined products prices on demand for transportation services," said Don Wellendorf, chief executive officer. "The large majority of our operating margin continues to come from historically stable fee-based services, and we have an extremely strong balance sheet to fund growth opportunities."

This security is in a bit of a downturn. If you can pick some up around $25, you'd be stealing it.

Plains All American Pipeline (PAA). The company beat third quarter estimates with the CEO, Greg Armstrong, painting a rosy forecast: "We continue to see strong demand for our assets and services within each of our three segments, and we are pleased with PAA's positioning relative to the current state of the financial markets. We have a solid balance sheet, ample liquidity and are well positioned to execute our growth plans for the remainder of 2008 and the full year of 2009 without the need to access the capital markets."

The security is a good buy at current levels of $34; even better if you can get it around $30.

Kinder Morgan Energy Partners (KMP). This company keeps coming up on all of the high-dividend stock screens. Many Wall Street know-it-alls also like it—what can I say? It is the King Kong of the pipeline MLPs. I haven't seen any news to knock it, but I haven't seen any news that makes me want to love it, either. It's trading around $50; if it was five bucks cheaper I'd like it a lot more.

Nustar Energy (NS). Not only is Nustar an energy play, but with its asphalt refining capabilities, it's also an infrastructure play. It's two two two plays in one!

“While we expect earnings for the fourth quarter of 2008 to be down significantly from the third quarter primarily due to the seasonality of the asphalt operations, the full year of 2008 should be a record year with the highest annual earnings in the partnership’s history. Longer-term, we expect that asphalt supply markets will continue to tighten and margins will increase as the refinery coker units come online. And, although we have identified approximately $500 million of high-return internal growth projects that could be completed over the next two to three years, we have scaled back our budgeted strategic and reliability capital expenditures in 2009 to approximately $150 million in light of the current capital markets environment,” said Curt Anastasio, Nustar's CEO.

The security would have been a good buy at $41 when it traded near its low today. Try to catch it under $45.

Buckeye Partners (BPL). Company revenues are increasing as well as its distribution. The company hasn't missed a distribution payment in over 21 years. Forrest Wylie, CEO, maintains a positive operating outlook: "In connection with the current credit crisis, I would like to emphasize that Buckeye is in the favorable position of having a strong balance sheet that allows us to fund our current slate of internal growth projects with cash flow from operations and debt rather than equity. We have sufficient borrowing capacity available to us under our $600 million revolving credit facility. Our conservative approach to risk and credit metrics has put us in a good position in these times of tightening credit markets."

Anywhere at this level ($36) is a good buy.

Atlas Pipeline (APL) also showed up on the screener but it's a much riskier choice than the others. John Tysseland, an analyst at Citi, cut his ratings from Buy to Sell on the company last month citing increasing risk to Atlas unitholders. "Simply stated, as the price of crude continues to weaken the risks to Atlas Pipeline unitholders continue to mount," Tysseland said in a note to clients. “Atlas may have to cut its distribution if crude prices stay at current levels, and if they average below $60 a barrel for an extended period of time the company could violate its debt covenants,” he said.

The stock is trading at record lows and showed some price firming in today's strong market close. If you think that oil has found a bottom, you might want to dip your toe into the Atlas waters. It's distribution yield is 31%, but I wouldn't count on that lasting for too long.

Other popular picks
For the sake of completeness, I thought I'd include other MLPs (not necessarily oil & gas pipeline companies) that many Wall Streeter's have been touting: Terra Nitrogen (TNH), Energy Transfer Partners (ETP), Enbridge Energy (EEP), and ONEOK Partners (OKS).

Summary
I only covered the oil & gas pipeline companies today but there are many more in the MLP space. Tomorrow I'll conclude the series with a quick look at the best of the rest. Despite today's end-of-day monster rally, that doesn't mean we're out of the woods. In that regard, I'd strongly suggest tempering your buying by spreading it out, meaning buy a fractional position today, another in a few more days, etc. You may end up paying more but then again, you may end up paying less. And I don't want you any unhappy campers out there.

Another Good Resource
I just found this article today. It provides further insight into MLPs and is written by one of my favorite financial writers, Michael Brush. (I like those MSN Money guys!)

Make your money grow 7% to 12%, by Michael Brush. MSN MoneyCentral. 9/3/08

*Watch for stock proxies in the form of options to make up the shortfall. What this means is that if an investor wants to take a loss in a certain sector, say the financials, she might sell those stocks this year to claim the tax loss while simultaneously buying options in the same sector to cash in on her positions just in case the sector rallies. Next year (and after 30 days), she can then sell the options and repurchase her stocks without tax consequences.