
 The first is Stanley (SXE). It began forming the left shoulder at the beginning of last November and completed its pattern when it fell below the neckline level of $30 almost three months later. Note that volume levels surged at the top of each peak with each succeeding volume level being less than the previous one. At the top of the head, the price was around $38, so we would expect a price target of around $22 ($30 - $8). The price did reach a low of $22.68 on February 14th (Happy Valentine's Day!) before it turned around.
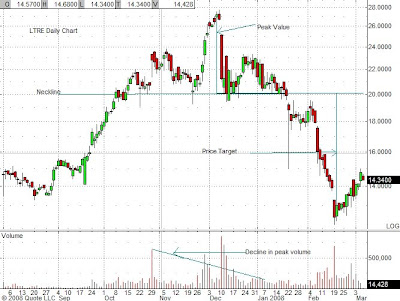 The next example is Learning Tree (LTRE). The left shoulder began forming in the middle of October, the head formed two months later, the right shoulder about three weeks after that until the neckline was finally broken by a downward gap on January 22nd. The peak to neckline value was $7 giving our price target of $13. This value was exceeded by the climactic low on Feb. 19th when the stock bottomed just above $12.
You can see that both stocks exhibited all of the criteria for a successful head-and-shoulders pattern: 1. The shoulders are roughly symmetrical and of the same height 2. The volume at each successive peak declined 3. There was a big run-up in the stock prior to reversal.
Now that you can identify this pattern, let's look at some strategies that will help you make the most out of this situation. One strategy is to simply short the stock when the price breaks the neckline and exit when it approaches its price target (If the stock doesn't quite reach it's target and the price is reversing on heavy volume, cover your position.) A better and much more profitable strategy is to buy put options. Let's compare the two.
Suppose you shorted LTRE when it broke support at $19/share and covered 19 trading days later when it exceeded its price target, say at $12.50/share. The net result would be $6.50/share, or $650 on a $1900 investment. That's a 34% gain on your investment or a 450% annualized return. Pretty darn good!
But what if you had purchased puts instead of shorting the stock? Well, unfortunately neither of the above-mentioned stocks are optionable so I'm going to have to do a rough comparison using my handy-dandy Black-Scholes calculator to compute options pricing. In the case of LTRE, had you purchased the April 20 puts, the cost would have been roughly $1.85 and you could have sold them for $7.40, a gain of $5.55/contract. Assuming you have the same $1900 to invest, that means that you could have purchased 10 contracts at a total cost of $1850. Your realized gain would then be 10 x 100 x $5.55 = $5550, a return of over 300%. The annualized gain in this case would be a whopping 3950%! If you're in an especially greedy mood, you could also write a bear-call credit spread (e.g. buy an April 25 call and sell an April 20 call) at the same time you buy the puts. The credit you receive from the spread will offset the price of your puts thus increasing your return even more. No wonder traders love this chart pattern!
I hope you now have a clearer picture of how head-and-shoulders patterns work and a few ways to play them. When I find stocks that are setting up in this pattern, I'll let you know and hopefully we can both profit.
It's a beautiful day and Fifi wants to tidy up my desk, so I think I'm going to take a long walk on the beach with Moondoggie. Toodles!
Thursday, March 6, 2008
Head & Shoulders Patterns - Examples & Strategies
Yesterday we looked at two powerful chart reversal pattern indicators, double tops and head-and-shoulders patterns. I mentioned that I would try to find some recent examples of a head and shoulders pattern, and I did. Let's see how they fared.
Subscribe to:
Post Comments (Atom)


No comments:
Post a Comment